
Statistics Masterclass Blog
Explanations, background, and advice for curious students.
Latest articles

Why so many things are bell-shaped, and why some are not
Heights, measurement errors, and exam scores follow the bell curve. City sizes, earthquakes, and fortunes do not. The central limit theorem explains the first group, and a different kind of arithmetic explains the second.
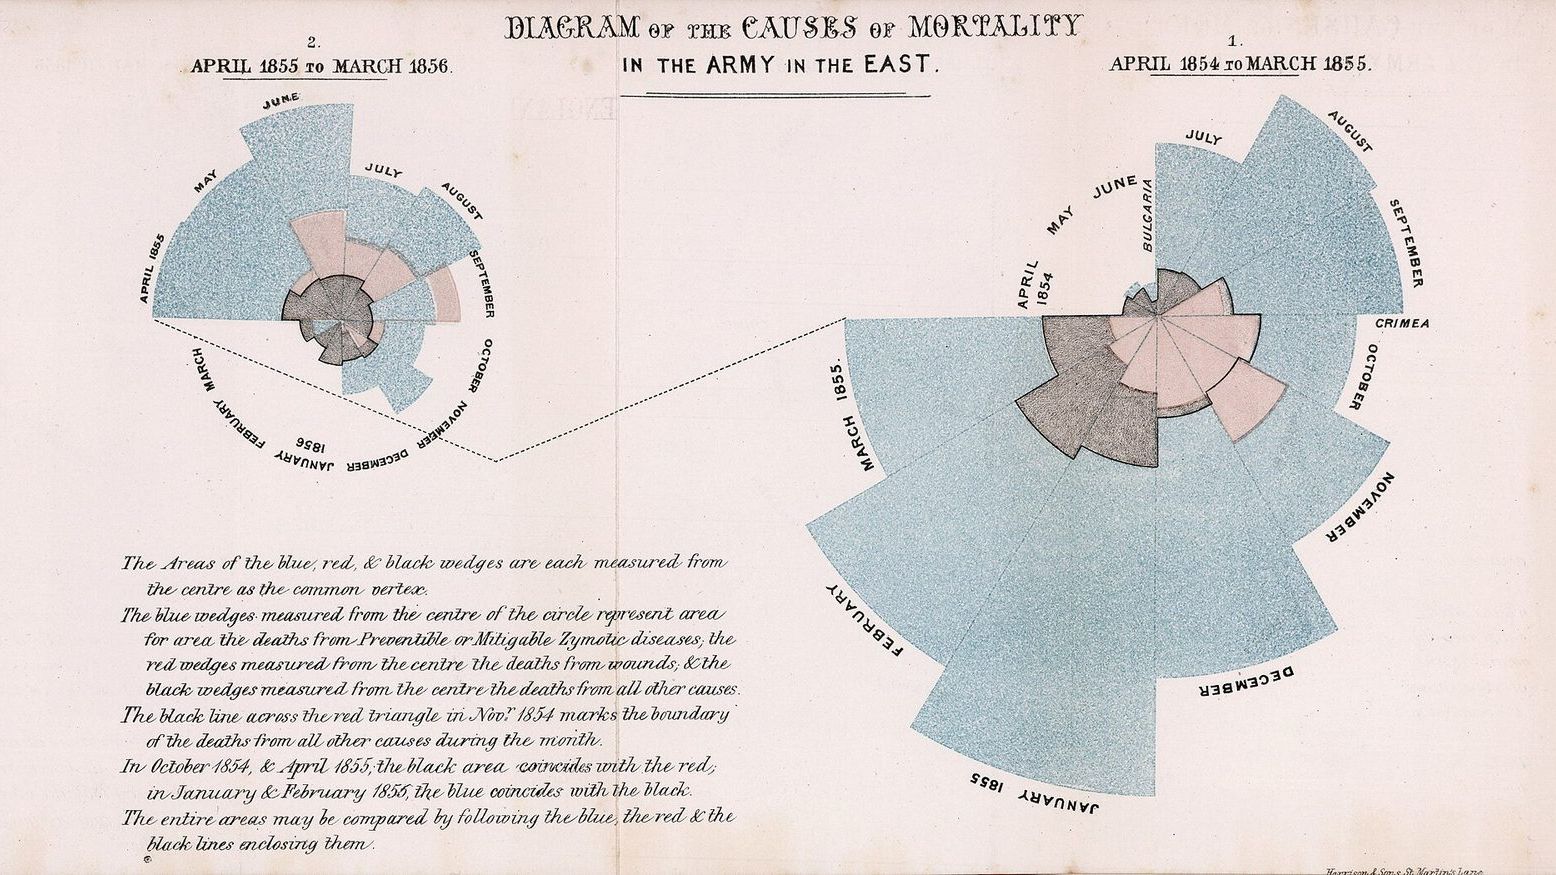
Florence Nightingale's rose
In 1858 Florence Nightingale drew a diagram showing that far more British soldiers in the Crimean War had died of disease than of wounds. How to read the rose diagram, where it misleads, what it achieved, and how she became the first woman in the Statistical Society.
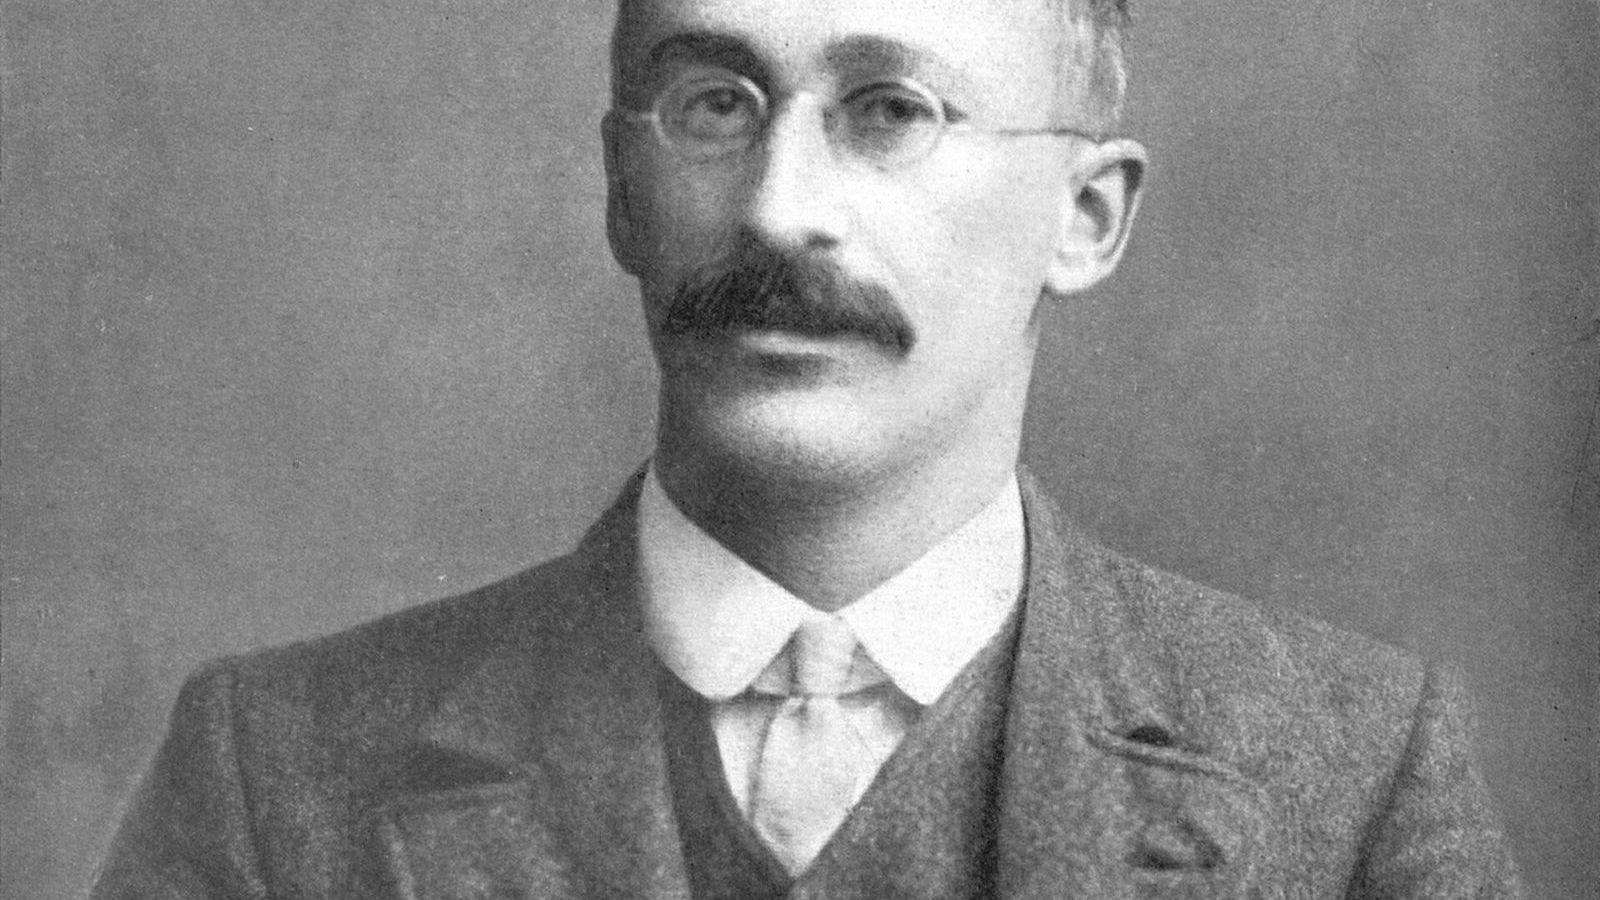
The brewer who signed his papers "Student"
William Sealy Gosset worked for the Guinness brewery in Dublin and needed to draw conclusions from a handful of measurements. His 1908 paper, published under a pen name because his employer forbade publication, gave statistics the t distribution and the small sample its proper uncertainty.
A positive test is not a diagnosis
A screening test that is right 90 per cent of the time can give a positive result that is wrong nine times out of ten. The reason is the prevalence of the disease, and an array of 1,000 people makes it plain in a way that Bayes' theorem on its own does not.
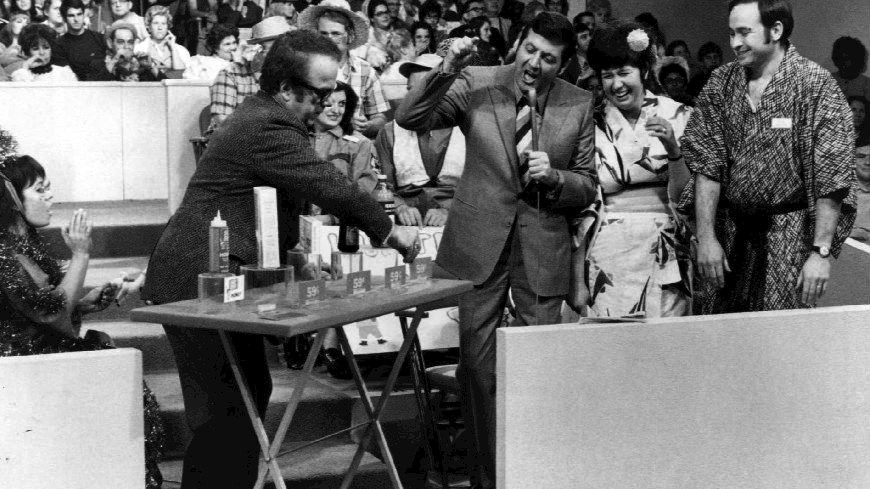
Monty Hall, settled by counting
Three doors, a car, two goats, and a host who opens a door he knows is empty. Switching wins two times in three. Here are the cases counted out, the 1990 letters that told Marilyn vos Savant she was wrong, and the version of the problem in which switching really does not help.

The birthday problem, worked out
With 23 people in a room, the chance that two of them share a birthday is just over one half. The calculation takes five lines, and the same idea explains matching PINs, shared birthdays in a football squad, and why computer security people worry about collisions.
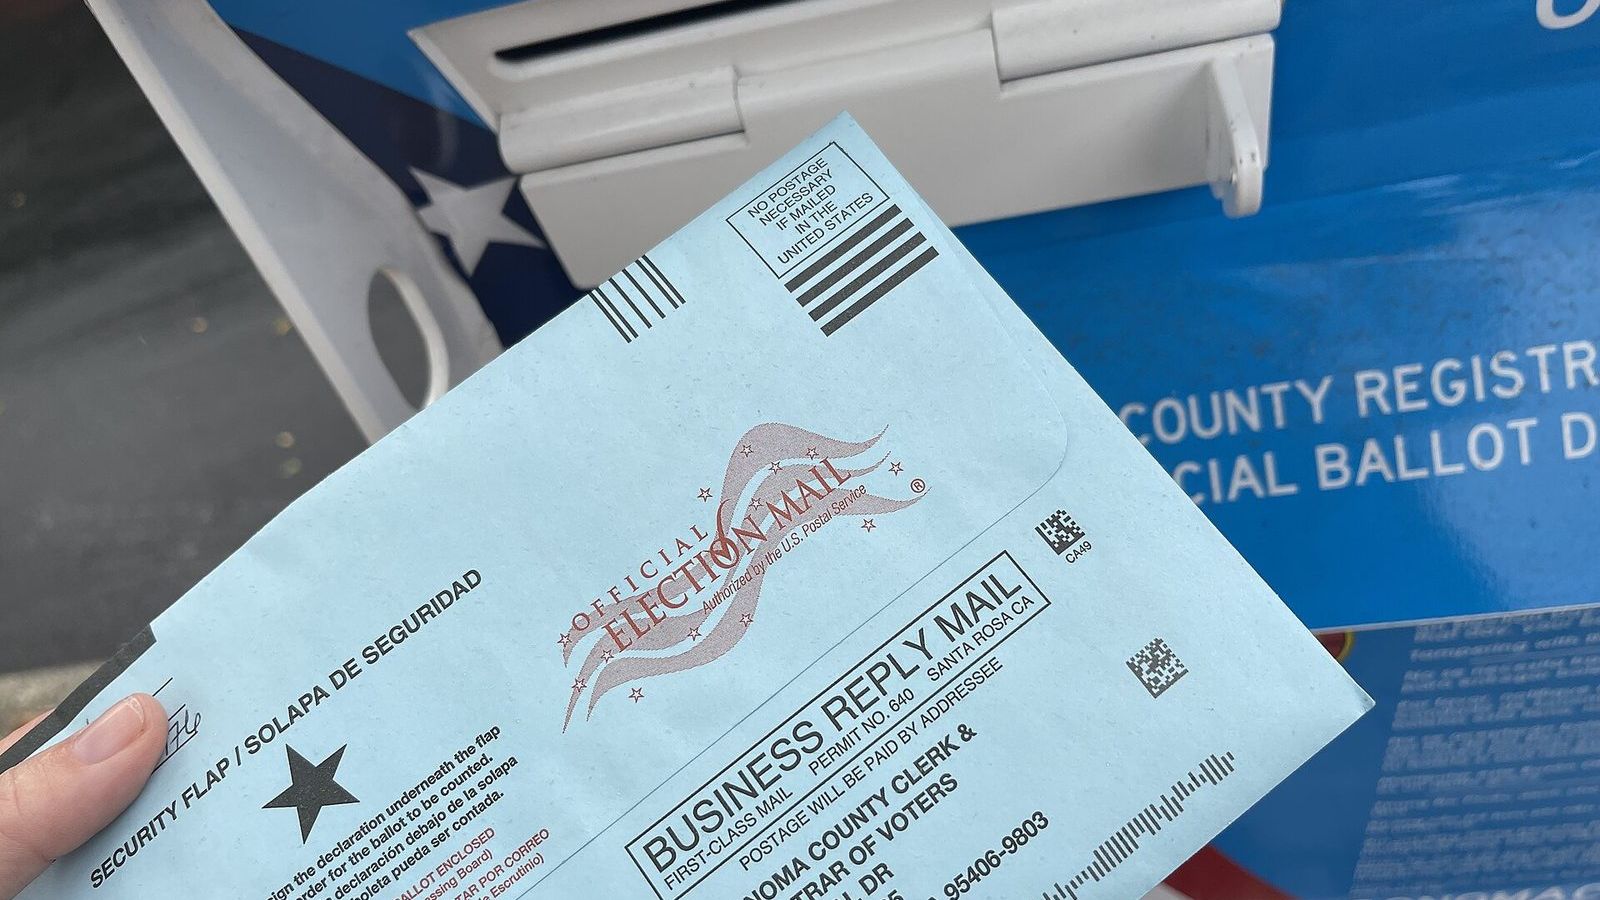
How a poll of 1,000 people can speak for a country
A random sample of 1,000 people estimates a proportion to within about 3 percentage points, whether the country has 300,000 inhabitants or 300 million. Here is the arithmetic, what it assumes, and what the margin of error leaves out.
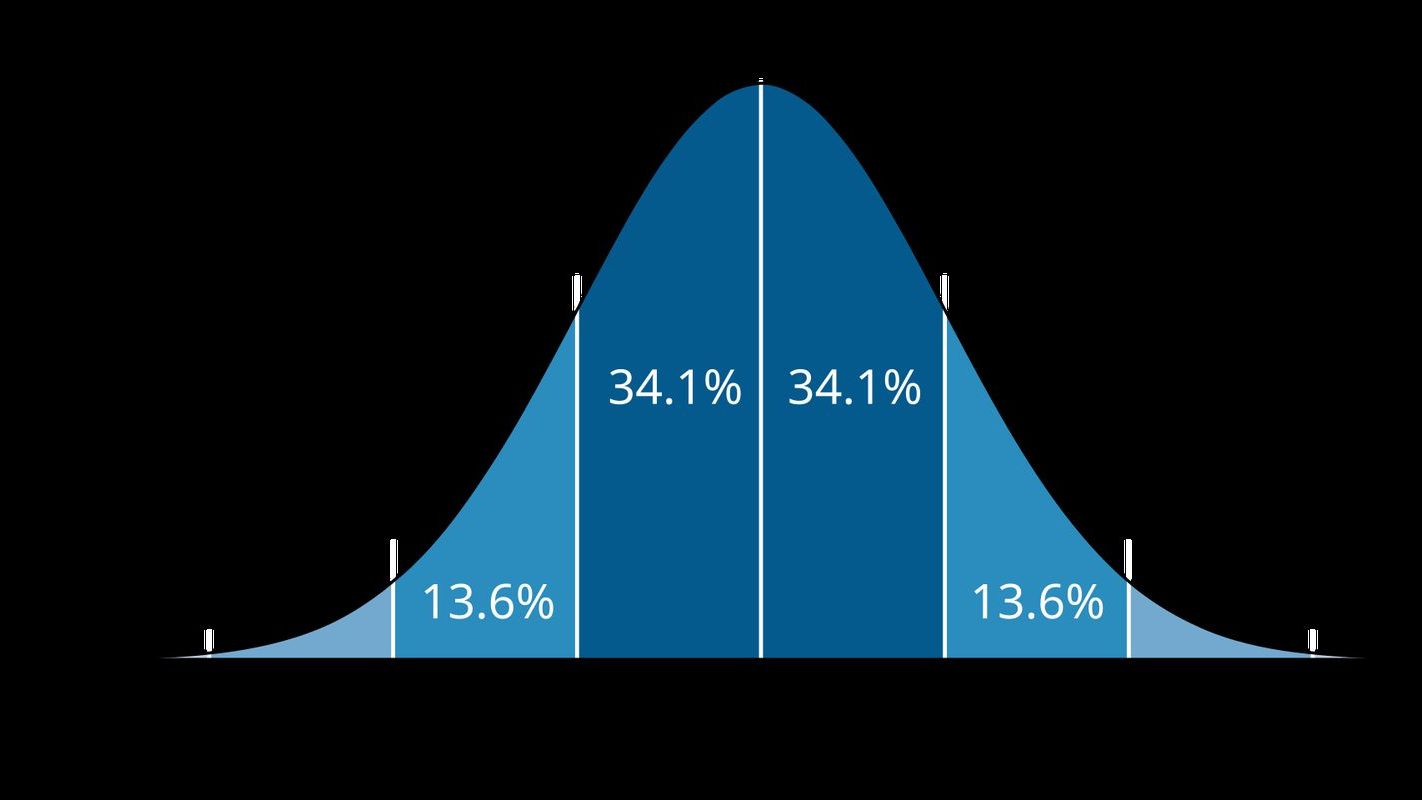
What a p-value is, and what it is not
A p-value is the probability of data at least as extreme as yours, if the null hypothesis were true. It is not the probability that the hypothesis is true, and it is not the probability that your result is a fluke. The definition, the three common misreadings, and the six principles of the American Statistical Association.
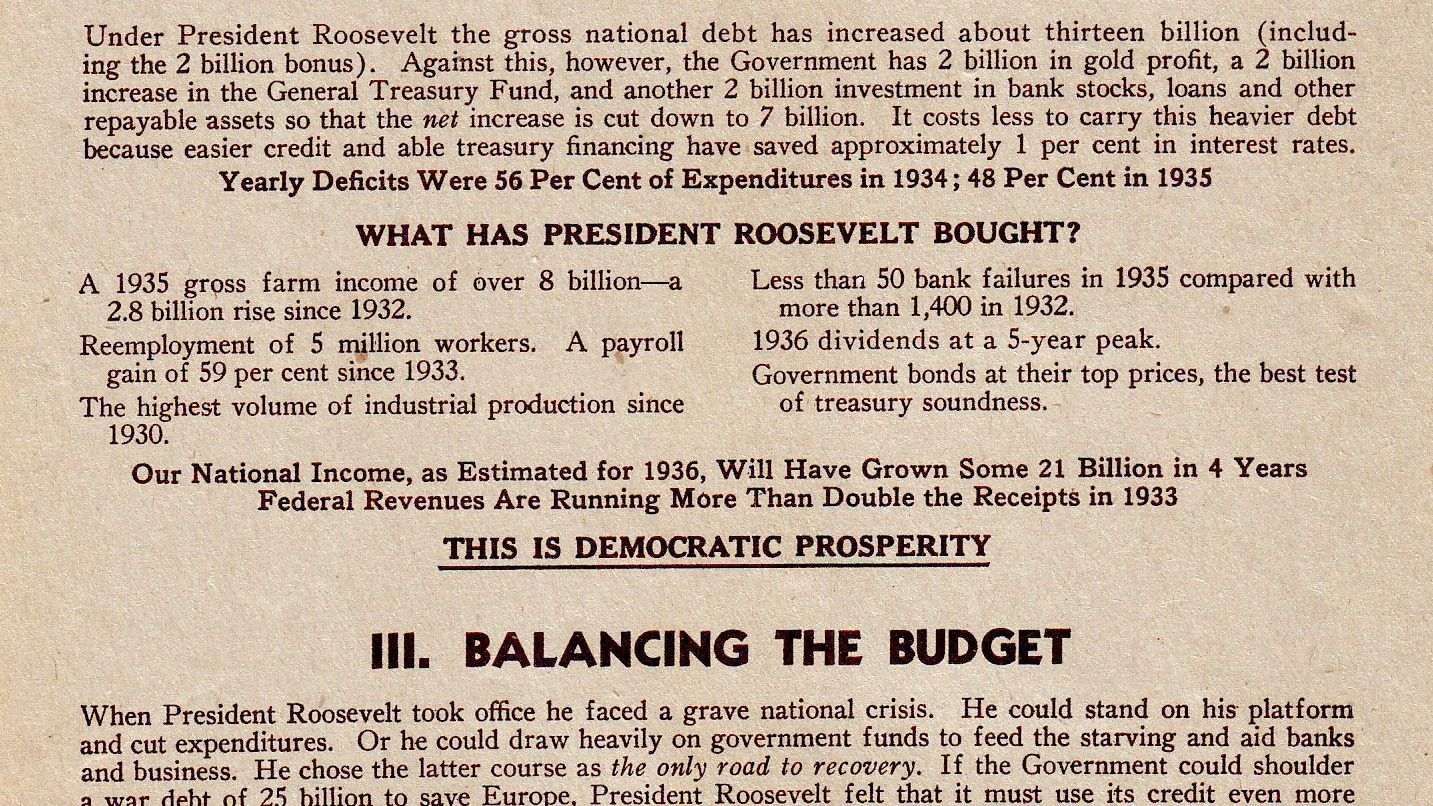
Why 2.4 million ballots got the 1936 election wrong
The Literary Digest collected 2.4 million mailed ballots and forecast a clear win for Alf Landon. Franklin Roosevelt won 46 of 48 states. A short history of sampling bias, and of the much smaller polls that called the result correctly.