
Statistics Masterclass12-Week Program in Statistics
Study one unit per week and learn how statisticians turn noisy data into conclusions they can defend, with real data sets and the research of today.
Start the MasterclassView the Curriculum
- Certificate
- Online
- Join a community of 2000+
Our alumni study at


About the program
A new unit reaches you every week: a chapter written for this program, with worked examples on real data sets and the research of statisticians active today. A quiz completes each unit and opens the next.
- Structured.
- A fixed sequence from a single list of numbers to regression, Bayesian inference, and the methods of statistical learning.
- Demanding and fair.
- Every formula is derived in small steps and used at once on a worked example.
- Recognized.
- A certificate and a transcript, each with a verification ID that anyone can check online.
Who is this program for?
For high school students, university students, and lifelong learners. School mathematics is enough to begin.
High School Students
A head start before university, and the numbers in the news explained. The masterclass covers the probability and statistics of AP Statistics, A-level Mathematics, and the IB Diploma.
- School mathematics is enough
- Certificate for applications
- A head start in data science
University Students
A supplement to a degree in psychology, biology, economics, medicine, or any subject that runs on data. Prepare for statistics lectures, a dissertation, or a first research project.
- Derivations and worked examples
- Current research papers
- A base for a first project
Lifelong Learners
Check the numbers in opinion polls, medical headlines, and sports analytics yourself. Meet the people who invented it, from Florence Nightingale to the Guinness brewer who signed his papers “Student”.
- No deadlines, pause any time
- Unit 1 refreshes the mathematics
- Read on screen or as PDF
How it works
From enrolment to certificate in six steps.
Enrol
Create your account, choose your masterclass, and pay the Tuition Fee. Your program starts at once.
Receive your unit
Unit 1 arrives immediately, every further unit on a Monday, as a web page and as a PDF to keep.
Study
Text, worked examples, derivations, and the dataset of the week. Further reading with current research follows a day later.
Take a quiz for every unit
Ten questions, open book, no time limit. Submit it before the next unit is sent to you.
Sit the final exam
50 questions across your masterclass in 60 minutes, open book. Pass with 70%, with up to 3 attempts.
Earn your certificate
Certificate and transcript as PDF, each with a verification ID and a personal link to share.
Sixteen units
One unit a week, each with its quiz. Every sketch shows the idea of its unit, with the one value it is about in red.
The Core of Statistics, Units 1 to 8 In every masterclass
- 1Data, Variables, and the Statistician's Toolkit
- 2Describing Distributions
- 3Probability and Conditional Probability
- 4Random Variables and the Normal Distribution
- 5Sampling and the Central Limit Theorem
- 6Estimation and Confidence Intervals
- 7Hypothesis Tests and p-Values
- 8Correlation, Regression, and Causation
Models and Inference, Units 9 to 12 Added in Advanced
Statistical Learning, Units 13 to 16 Added in Advanced + Statistical Learning
Sketches for Units 6, 11, 13, and 16 are simulated with a fixed seed, Units 14 and 15 are schematic drawings; the others are drawn from published data (Student 1908, Anscombe 1973) or computed exactly.
Read all sixteen summaries
- Data, Variables, and the Statistician's Toolkit. The toolkit of the program. What data are and the kinds of variables, population and sample, parameter and statistic, the summation sign and the mean, proportions, percentages, and rates, relative against absolute change, powers of ten and the logarithmic axis, the rules of an honest graph, and how data are collected, with a short history of counting people from the Bills of Mortality to Hollerith's machine.
- Describing Distributions. How to turn a long column of numbers into a picture and a few honest summaries. The unit builds the histogram and shows what the bin width does to it, defines the mean, the median, the standard deviation, and the interquartile range and says when each is the right choice, packs five numbers into a box plot with Tukey's fences for outliers, standardizes measurements with z-scores so that a height and a weight can be compared, summarizes categorical data in frequency and two-way tables, and asks of every summary how badly one far-out value can fool it.
- Probability and Conditional Probability. Probability is the language in which every later unit states how sure it is. This unit teaches what a probability means and the three axioms it obeys, how to count outcomes with factorials and binomial coefficients, how information changes a probability, and how Bayes' theorem turns the accuracy of a medical test into the chance that a positive result is right. The birthday problem, the Monty Hall problem, the lady tasting tea, and the case of Sally Clark show the rules at work and the cost of breaking them.
- Random Variables and the Normal Distribution. A random variable attaches a number to the outcome of a random experiment, and its expected value and variance say where that number sits on average and how far it strays. This unit builds the rules for sums and multiples, then the three distributions that carry most of applied statistics: the binomial for counts of successes, the Poisson for counts of rare events, checked against the Prussian horse-kick deaths, and the normal curve, read term by term, standardized, and tabulated, with the 68-95-99.7 rule, the normal approximation to the binomial, and a first warning that heavy-tailed quantities such as incomes and city sizes are not normal.
- Sampling and the Central Limit Theorem. A poll of 1,000 people speaks for a country, and 2.4 million ballots once named the wrong president. This unit explains how a random sample is drawn, why bias does not shrink with size, and how far the mean of a sample can stray from the mean of its population. It draws thousands of samples from real data, derives the standard error, states the law of large numbers and the central limit theorem with their conditions, and ends with the Galton board and the margin of error of a poll.
- Estimation and Confidence Intervals. A sample statistic is never the truth about the population, so the honest report is a number with a range around it. This unit builds that range: what makes an estimate good, why the sample variance divides by n - 1, the confidence interval for a mean and what 95 per cent confidence promises, Student's t distribution for small samples, the interval and the margin of error of a poll, planning a sample size, paired data, and the comparison of two groups.
- Hypothesis Tests and p-Values. A difference in a sample can be a real effect or the ordinary wobble of chance, and a hypothesis test is the controlled way to tell the two apart. This unit builds the test on Fisher's lady tasting tea, defines the p-value exactly, carries out the z, t, paired, and two-sample tests, sets out the two kinds of error and the power of a test, plans the size of a trial, tests two proportions on Snow's water companies and tables of counts on Mendel's peas and Doll and Hill's smokers, and ends with what a p-value is not.
- Correlation, Regression, and Causation. The closing unit of the Foundation masterclass measures the relation between two variables with the correlation coefficient, summarizes it with the least-squares line, and asks what such a relation can and cannot show. Galton's family heights give the coefficient, the line, and regression to the mean; Anscombe's quartet shows what one number hides; the kidney stone data reverse a comparison; and the smoking debate, Snow's water companies, and the draft lottery of 1969 show why a randomized experiment settles causation and what an accident of history can borrow from one.
- Likelihood and Maximum Likelihood. The first unit of the Advanced masterclass shows where the estimates of the Foundation units come from. The probability formula of a model is read backwards, as a function of the unknown parameter with the data held fixed, and the value that makes the observed data most probable is the maximum likelihood estimate. The unit teaches the derivative before it uses it, derives the estimates of a proportion, a Poisson rate, and a normal mean and variance, reads the standard error from the curvature of the log-likelihood, and turns the drop in log-likelihood into a test and an interval, with coin flips, horse kicks, geysers, earthquakes, and the words of Moby-Dick as the data.
- Multiple Regression and Linear Models. Almost every response worth modelling depends on several predictors at once. This unit extends least squares to the multiple regression model, teaches what a coefficient means when the other predictors are held fixed and why it changes when one is left out, puts categorical variables into the model as indicators, and tests coefficients and whole models with t and F statistics. It ends with the residual checks that decide whether a fit deserves belief and with prediction intervals for a new case.
- Logistic Regression and Generalized Linear Models. Many responses are a yes or a no, or a count, and a straight line cannot model them. This unit models the log odds of an event as a straight line, reads the coefficients as odds ratios, and fits the model by maximum likelihood with the Challenger O-ring data as the running example. It turns fitted probabilities into decisions with sensitivity, specificity, and the ROC curve, models counts with a Poisson regression and an offset for exposure, and ends with the generalized linear model that holds linear, logistic, and Poisson regression together, compared by the deviance.
- Bayesian Inference. Bayes' theorem turns a prior distribution and a likelihood into a posterior distribution for a parameter, and the unit works this through in full for a proportion, where a Beta prior and binomial data give a Beta posterior, and for a mean, where precisions add. It explains what a credible interval promises and what a confidence interval promises, how to choose a prior and show that it did not decide the result, why a batting average after 30 at-bats is shrunk towards the league, and how the Metropolis algorithm draws samples from a posterior that nobody can write down, with the diagnostics that say whether the run can be trusted.
- The Bootstrap and Cross-Validation. The first unit of the Advanced + Statistical Learning masterclass turns from estimating parameters to predicting new data, and lets the computer stand in for formulas. Polynomials of rising degree fitted to the Old Faithful eruptions show why the training error flatters a model and the test error does not, and the bias-variance decomposition explains the shape of the test error curve. The bootstrap gives a standard error and an interval for a median and a correlation by resampling the data, with the result that a bootstrap sample holds about 63 per cent of the observations. Ten-fold cross-validation chooses the degree of a polynomial, the one-standard-error rule leans towards the simpler model, and the sleep data of Unit 7 are tested again by flipping the signs of the ten differences.
- Ridge, Lasso, and Regularization. Least squares comes apart when predictors are correlated or more numerous than the observations: the coefficients swing to absurd values, and with more predictors than patients there is no unique fit at all. This unit adds a price to the size of the coefficients. Ridge regression charges for squared coefficients and shrinks all of them, and the lasso charges for absolute values and sets some exactly to zero, so that it selects predictors while it fits; the diabetes data of 442 patients and the fuel consumption of 32 cars show both at work. The penalty is chosen by cross-validation with the one-standard-error rule, the penalties turn out to be Bayesian priors in disguise, and a worked example shows how many of 5,000 unrelated genes will look correlated with an outcome by chance alone.
- Trees, Random Forests, and Boosting. A decision tree predicts by asking one yes-or-no question at a time, and the unit grows one by hand: the first split of a regression tree for the fuel economy of 32 cars and the Gini index before and after one split of the Palmer penguins. One tree is easy to read and unstable, so the unit averages hundreds of them on bootstrap samples, derives how far the correlation between trees limits the gain, and shows how the random forest lowers that limit and how the out-of-bag error comes free. Boosting then fits small trees one after another to the residuals, two rounds by hand on five cars and a derivation of why the residuals are the right target. A ten-fold cross-validation on the Cleveland heart disease data compares a tree, a forest, and a boosted model, and the closing section says what none of them can do.
- Multiple Testing and the False Discovery Rate. The closing unit asks what the 5 per cent level of Unit 7 turns into when a study runs twenty, ten thousand, or eight million tests. The family-wise error rate and the Bonferroni and Holm corrections guard against a single false positive; the false discovery rate of Benjamini and Hochberg replaces that goal by the fraction of false leads in a list, and their procedure is worked through on the fifteen p-values of a heart attack trial, on a simulated screen of 10,000 genes, and on the Manhattan plot of a genome-wide study of 39,620 children. A dead salmon, the garden of forking paths, and the hundred replications of 2015 show where uncounted tests lead, and the knockoff filter shows how the lasso's selections can be tested honestly.
Research presented in the program
Every unit has a research spotlight: the published work of a statistician active today, explained at your level and linked to the original paper.
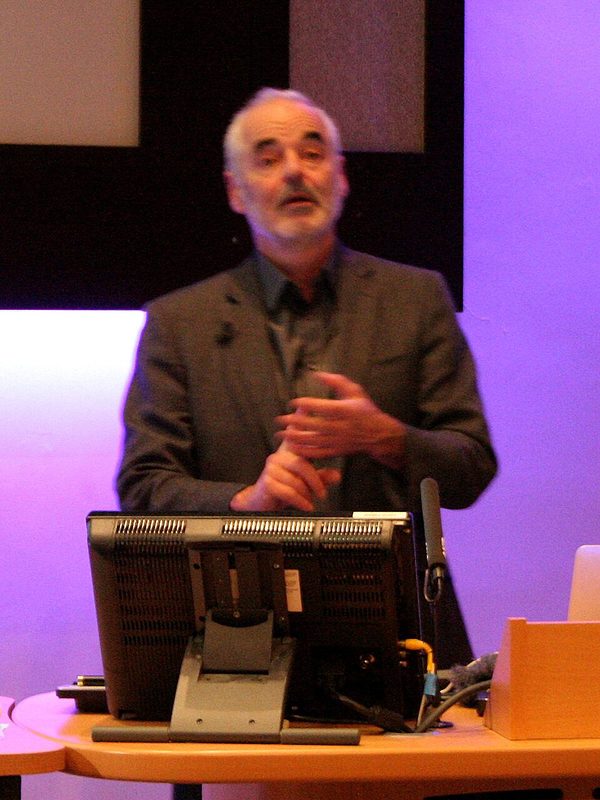 David SpiegelhalterUniversity of Cambridge
Statistics, the communication of risk and uncertainty
Presented in Unit 1 Persi DiaconisStanford University
Probability, the mathematics of randomization, Markov chains
Presented in Unit 3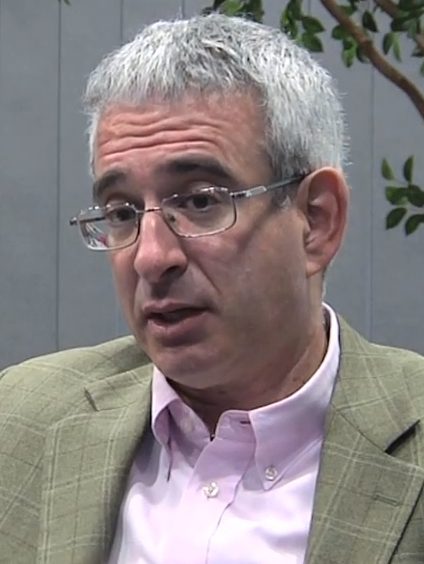 Joshua AngristMassachusetts Institute of Technology
Labour economics, econometrics of causal inference, natural experiments
Presented in Unit 8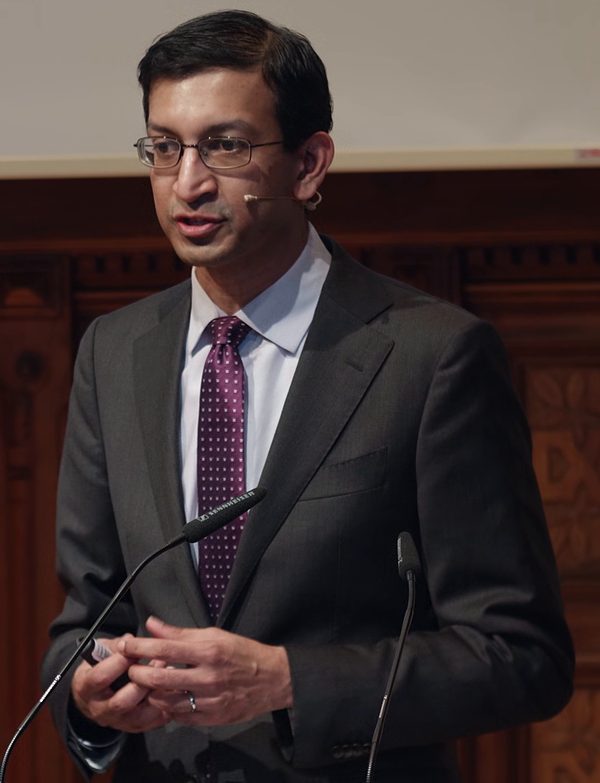 Raj ChettyHarvard University
Public economics, intergenerational mobility, the economics of opportunity
Presented in Unit 10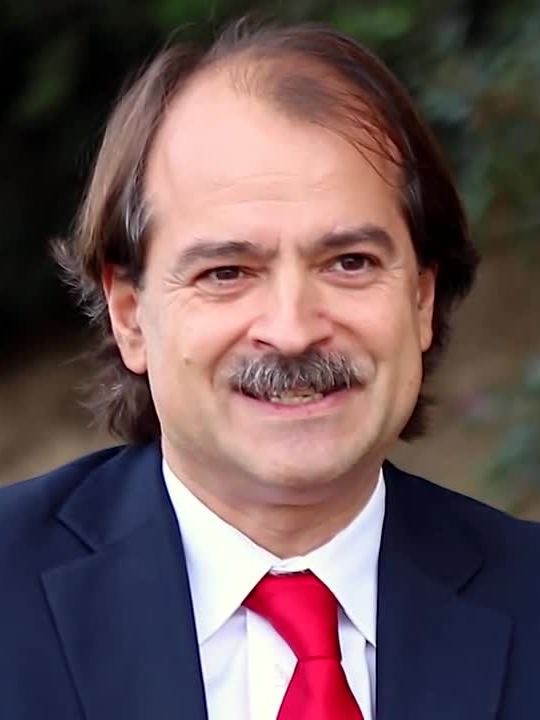 John IoannidisStanford University
Meta-research, epidemiology, evidence-based medicine
Presented in Unit 7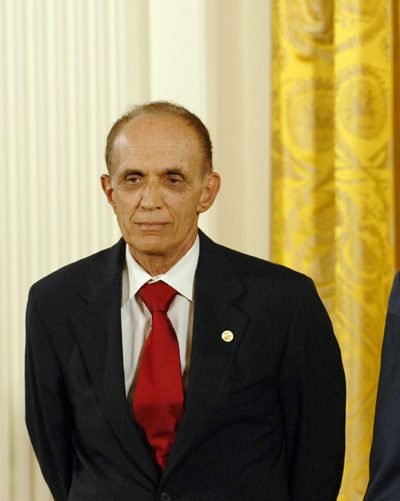 Bradley EfronStanford University
Statistical inference, resampling methods, empirical Bayes
Presented in Unit 13 Andrew GelmanColumbia University
Bayesian statistics, survey methodology, political science
Presented in Unit 6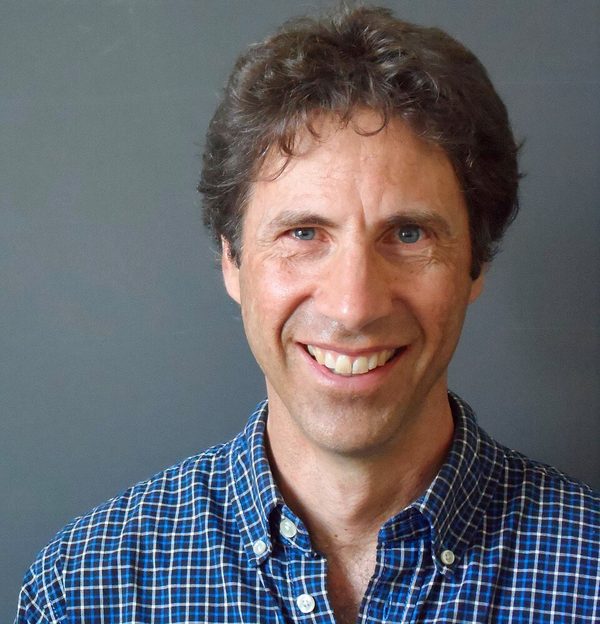 Peter BühlmannETH Zurich
High-dimensional statistics, boosting, causal inference
Presented in Unit 15
The scientists named here are not contributors to the Statistics Masterclass, are not affiliated with it, and have not endorsed it. The program presents and explains their published research, with references to the original papers.
Tuition Fee
One Tuition Fee, paid once, covers every unit, every quiz, the final exam, and your certificate.
| Masterclass | Tuition Fee now and formerly, chart | Tuition Fee | Enrol |
|---|---|---|---|
| Foundation8 units, 8 weeks | $35 |
Choose | |
| AdvancedMost chosen12 units, 12 weeks | $55 |
Choose | |
| Advanced + Statistical Learning16 units, 16 weeks | $85 |
Choose |
Tuition Fee now formerly
| Item | Foundation | Advanced | Advanced + Statistical Learning |
|---|---|---|---|
| Units as web pages and PDFs | 1 to 8 | 1 to 12 | all 16 |
| Weekly quizzes | 8 | 12 | 16 |
| Further reading and a summary email | every week | every week | every week |
| A dataset of the week | every week | every week | every week |
| Final exam of 50 questions | included | included | included |
| Certificate and transcript | included | included | included |
Tuition fees are one-time payments and include applicable taxes. Secure payment by card through Stripe.
Your certificate
Pass the final exam and receive an official certificate of completion. It states your name, the masterclass, its duration, and the units you completed.
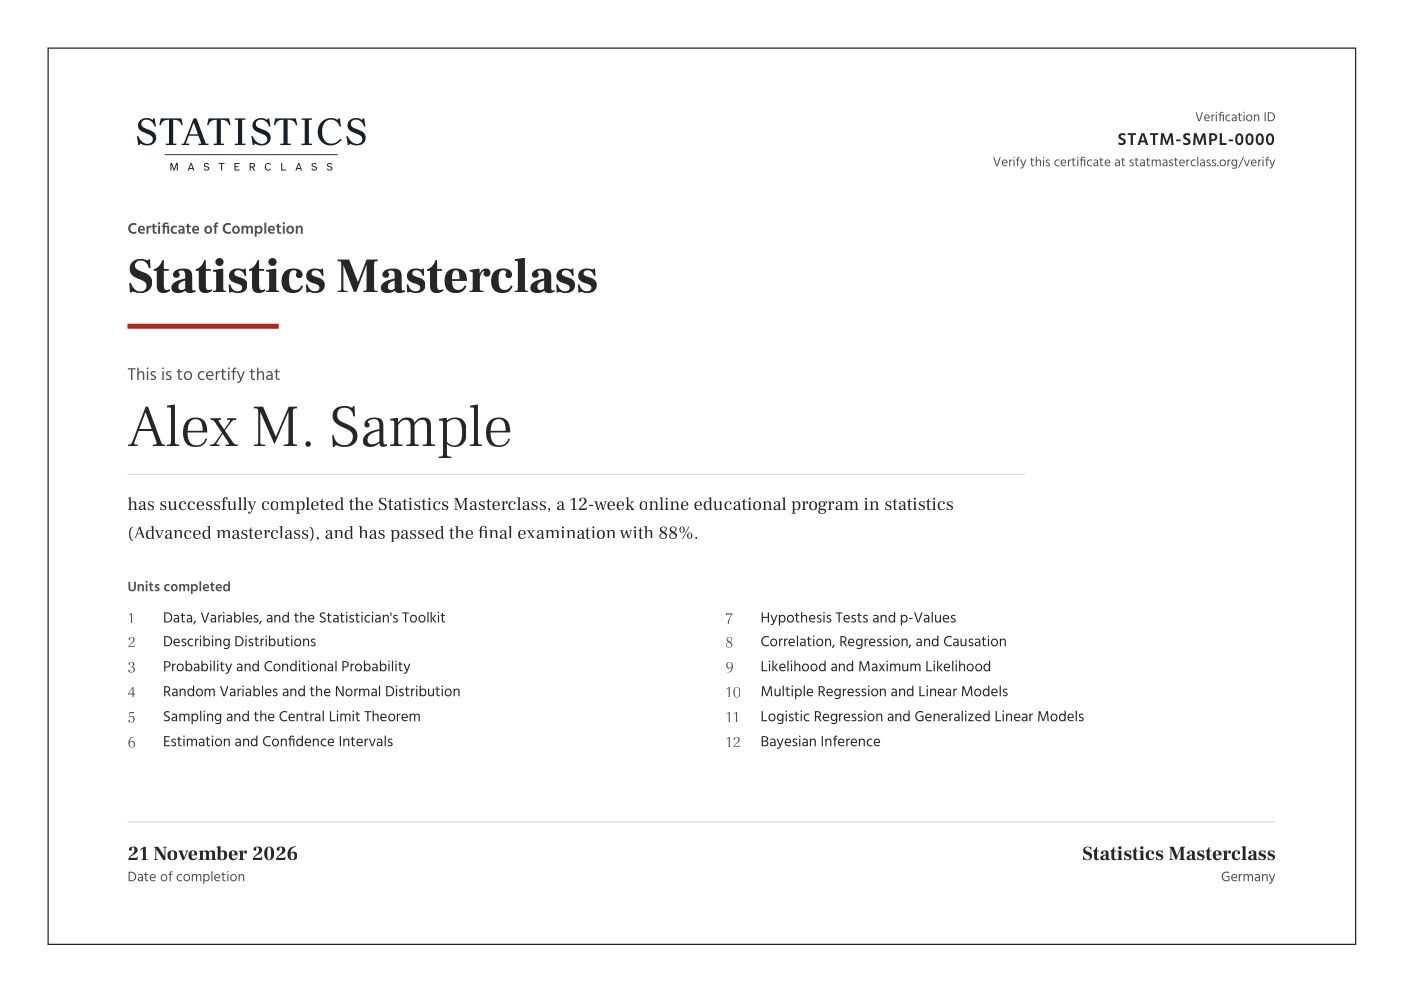
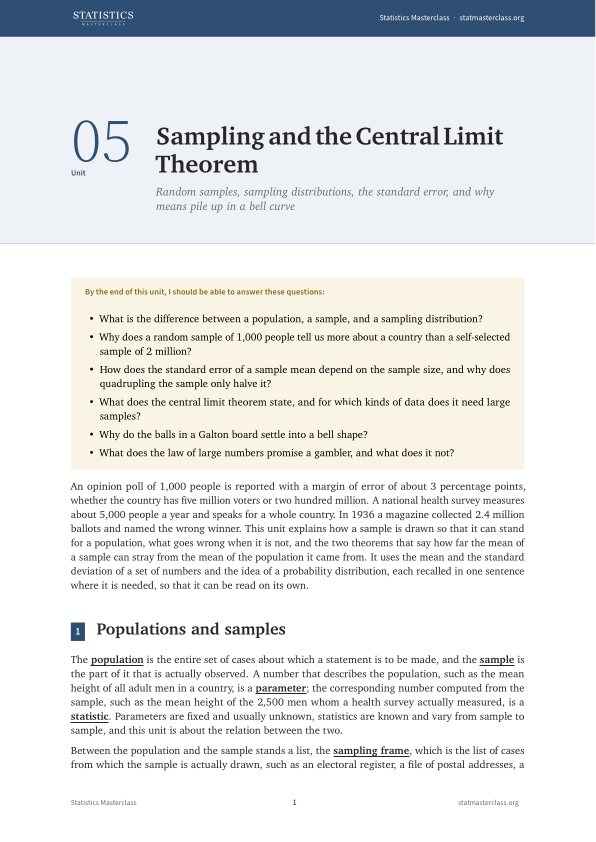
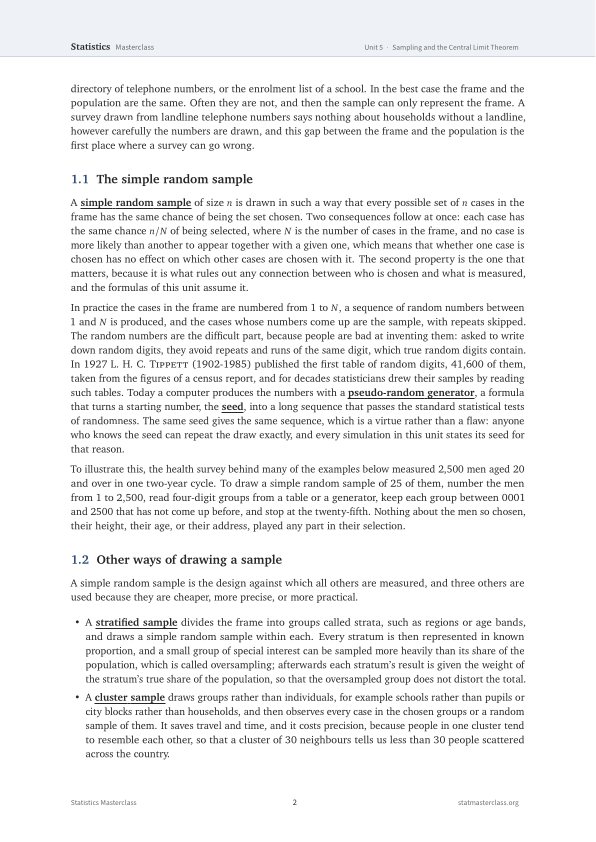
The first two pages of the 18.
Read Unit 5 in full
Sampling and the Central Limit Theorem is open to everyone before you enrol: all 18 pages, exactly as participants receive it.
A poll of 1,000 people speaks for a country, and 2.4 million ballots once named the wrong president. This unit explains how a random sample is drawn, why bias does not shrink with size, and how far the mean of a sample can stray from the mean of its population. It draws thousands of samples from real data, derives the standard error, states the law of large numbers and the central limit theorem with their conditions, and ends with the Galton board and the margin of error of a poll.
Opening questions
- What is the difference between a population, a sample, and a sampling distribution?
- Why does a random sample of 1,000 people tell us more about a country than a self-selected sample of 2 million?
- How does the standard error of a sample mean depend on the sample size, and why does quadrupling the sample only halve it?
- What does the central limit theorem state, and for which kinds of data does it need large samples?
- Why do the balls in a Galton board settle into a bell shape?
Academic community
Masterclass participants come from all over the world, and when you complete the program you stay part of a network that keeps you close to statistics and data science.
Stat-Connect
Our alumni program connects former participants across countries for study advice, university applications, and shared projects.
Opportunities
Past participants hear from us about scholarships, competitions, summer schools, and other opportunities in statistics and data science.
A place in research
The program shows how statistical research is done and where it happens, so your next step is an informed one.
From the blog
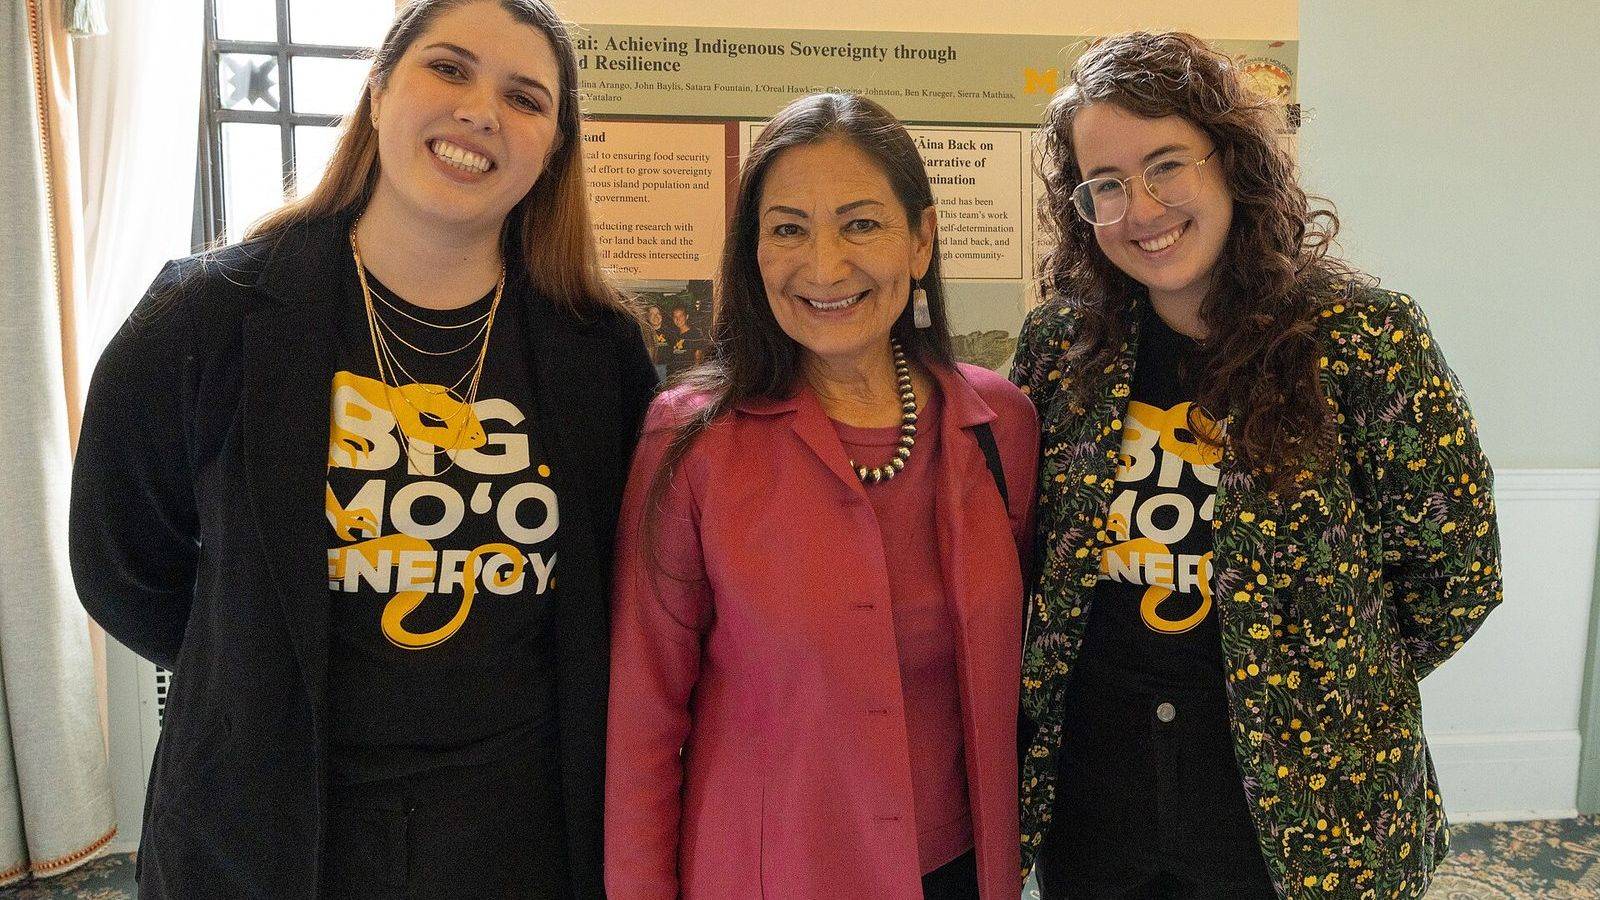
How to enter a statistics competition as a student
A poster competition for school students, a project competition, a weekend of data analysis for undergraduates, and online prediction contests open to anyone. What each one asks for, who may enter, and which units of the program prepare for it.
Why 36 of 100 psychology findings did not replicate
In 2015 the Open Science Collaboration repeated 100 published psychology experiments. Thirty-six of the replications were significant. Nobody found fraud; the causes were the garden of forking paths, publication bias, and small samples, and the remedies are now changing how science is done.

How a random forest makes a decision
A decision tree asks one question at a time and is easy to read and easy to fool. Grow hundreds of trees on resampled data, let each see only a random subset of the variables, and take a vote: that is a random forest, and the reason it works is the arithmetic of averaging.
Frequently asked questions
Who is this program for?
For high school students, university students, and lifelong learners. High school students use it to understand what the numbers in the news show, to get ahead before a degree in which data play a part, and to prepare for poster and project competitions. University students in psychology, biology, economics, medicine, or any subject that runs on data take it before a statistics lecture, a dissertation, or a first research project, and to understand the methods sections of the papers they read. Lifelong learners use it to check opinion polls, medical headlines, and sports tables themselves. The Foundation masterclass suits a first contact with the subject; the Advanced masterclass goes on to likelihood, regression with several variables, and Bayesian inference.
What do I need to know before I start?
School mathematics is enough: fractions, percentages, powers, roots, simple equations, and reading a graph. You do not need any prior knowledge of statistics or probability. Unit 1 teaches every tool the later units use, including the summation sign, percentage change against percentage points, and logarithmic scales. Counting rules are taught in Unit 3 before the binomial distribution needs them, and the Advanced units introduce the derivative as the slope of a curve in the unit before they use it, with every step shown.
Do I need software or programming?
No. Every calculation in the units can be done with a pocket calculator and the tables printed in the unit, and nothing in the quizzes or the final exam requires a computer. Each week also brings a dataset of the week, a free source of real data with two things to try, and that is where you can use a spreadsheet, R, or Python if you want to. Participants who have never used any of these can follow the whole program without them.
How much time do I need each week, and are there live sessions?
Most participants spend three to five hours a week: two or three hours on the unit, under an hour on the open-book quiz, and the rest on the worked examples and the dataset of the week if they want it. Units with long worked examples, such as the one on multiple regression, take more if you redo the calculations yourself, which we recommend. The program is fully online and has no live sessions, so it works in every time zone and next to school or work. You receive the units by email and read them on the website or as PDF; quizzes and the final exam are taken on the website.
Can I finish the program in less than 12 weeks?
Yes. A new unit is scheduled for every Monday, but once you have submitted the quiz of a unit you can ask for the next one ahead of schedule, from your dashboard or from the email we send you. The earliest moment is 24 hours after the previous unit was sent. We recommend the weekly rhythm, because the material needs time to settle, but the pace is your decision.
What happens if I fall behind or have to pause?
Nothing is lost. The next unit is only sent once you have submitted the quiz of the current one, so the program waits for you. You can pause for a week or for a term and continue at any time. There is no penalty and no deadline.
Stay up to date
New program dates, offers, and the occasional article about statistics and data. You can unsubscribe at any time.