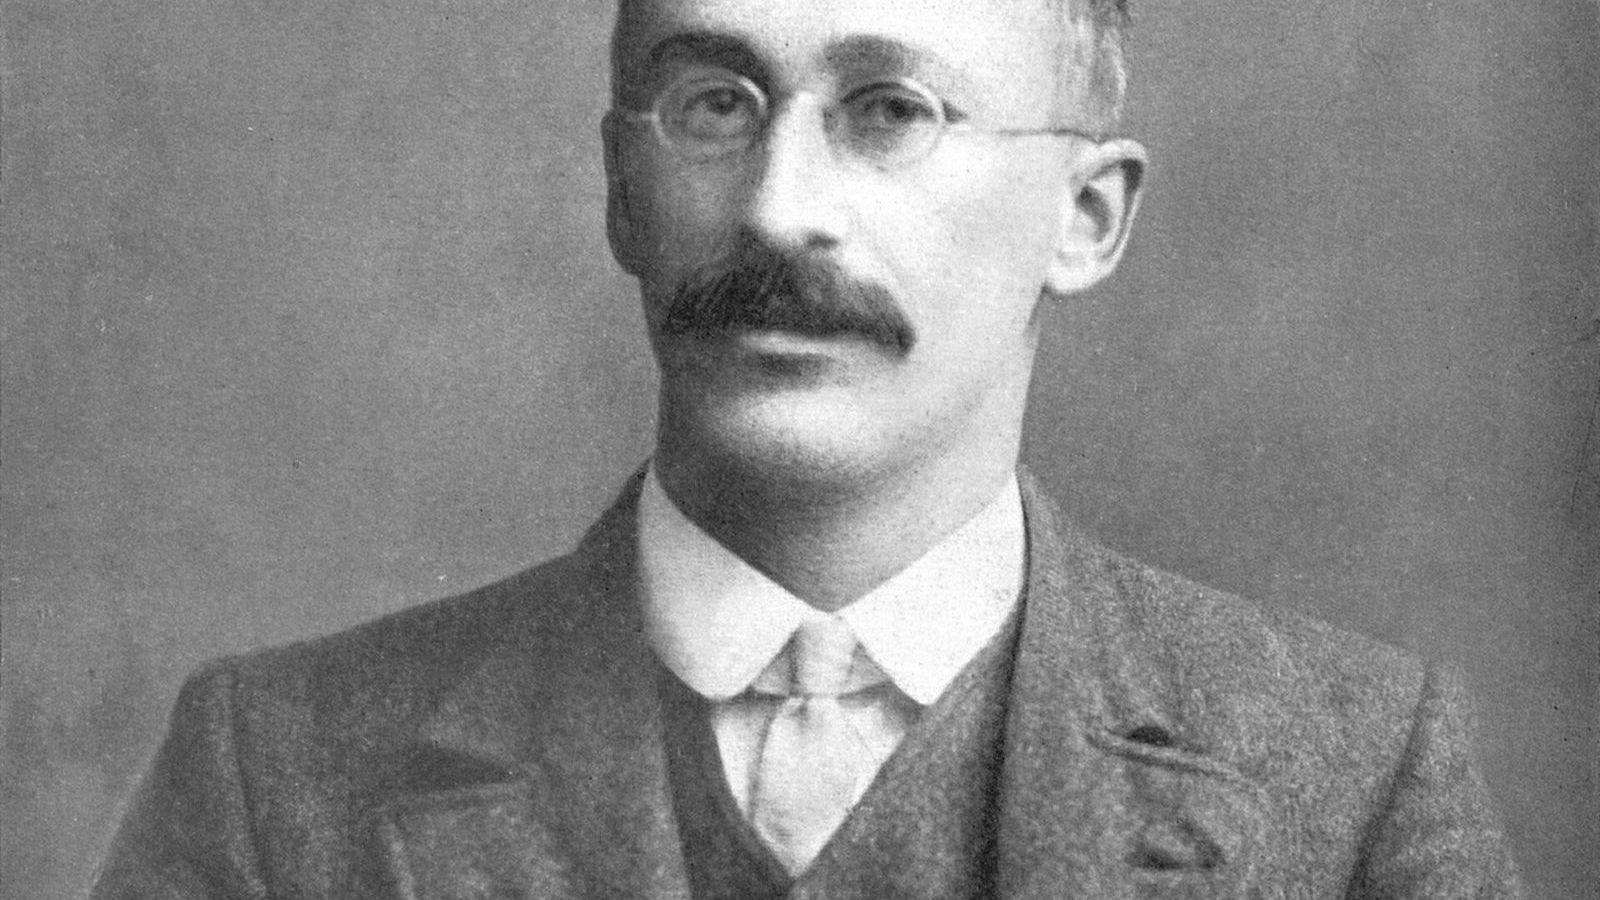
 Image: Unknown photographer, 1908, public domain
The brewer who signed his papers "Student"
Every statistics student learns the t-test, and most are told that it was invented by someone called Student. Few hear the rest. Student was William Sealy Gosset, a chemist employed by the Guinness brewery in Dublin, and the reason the most used test in science carries a pen name is that his employer did not allow its scientists to publish.
A brewery with a problem
Gosset was born in Canterbury in 1876, read chemistry and mathematics at New College, Oxford, and joined Guinness in 1899. The company was then the largest brewery in the world and had begun hiring scientists to put its processes on a measured footing. Gosset's work was to judge the quality of barley and hops and the effects of changes in the brewing process, and the difficulty was that he could never measure very much. A field trial of a barley variety meant a handful of plots. A test of a hop sample meant a few determinations of its soft resin content. His samples had four, eight, perhaps ten observations.
The statistical theory of the day, built by Karl Pearson and his school at University College London, assumed large samples. With hundreds of observations the sample standard deviation is close enough to the true one that it can be treated as known, and the mean of the sample then lies within about two standard errors of the truth in 95 per cent of samples, using the normal distribution. Gosset asked what happened when the standard deviation had to be estimated from the same four or eight numbers as the mean. Nobody had worked it out.
A year with Pearson, and a paper
Guinness gave him leave, and in 1906 and 1907 Gosset studied in Pearson's laboratory in London. There he derived the distribution of the quantity
\[ t = \frac{\bar{x} - \mu}{s/\sqrt{n}}, \]the distance of the sample mean from the true mean, measured in estimated standard errors. For large \(n\) this follows the normal distribution. For small \(n\) it does not: the estimated \(s\) in the denominator is itself uncertain, and when it happens to come out small, \(t\) comes out large. The result is a distribution with the same bell shape as the normal but heavier tails, and the smaller the sample, the heavier the tails.
The practical consequence is a wider interval. For a 95 per cent interval around a mean, the normal distribution says to go 1.96 standard errors out. Gosset's distribution with ten observations says 2.26, and with four observations 3.18. A chemist who used 1.96 with four measurements was claiming more precision than he had, and Gosset could now say by how much.
He checked the mathematics by simulation, by hand. He took the heights and left middle finger lengths of 3,000 criminals, from a dataset published by W. R. Macdonell, wrote each on a card, shuffled, and drew 750 samples of four. The distribution of his \(t\) across the 750 samples matched his formula. It is one of the first Monte Carlo experiments in the literature, done with pieces of cardboard.
The paper, The Probable Error of a Mean, appeared in Pearson's journal Biometrika in March 1908. The author was given as Student.
Why the pen name
Guinness regarded its scientists' work as trade secrets and had been embarrassed by an earlier employee's publication. It agreed to let Gosset publish on condition that neither his name nor the company's appeared and that no brewing data were used. Gosset chose Student. The arrangement held for his entire career; his later papers, about twenty of them, carry the same name, and the statisticians who corresponded with him knew who he was while the readers of Biometrika did not.
Ronald Fisher, then a young mathematician, read the 1908 paper, saw that Gosset's derivation was incomplete, supplied the rigorous proof in 1912, and in his 1925 book turned the result into the t-test that students now learn, with its tables and its degrees of freedom. Fisher and Gosset corresponded for twenty years and remained friends through Fisher's quarrels with almost everyone else. After Gosset's death in 1937 Fisher wrote that he had been the Faraday of statistics, a man who found a new thing by looking carefully at a practical problem.
The ten patients
Since Guinness data were forbidden, Gosset illustrated the method with data from elsewhere. One of his examples came from a 1905 paper by Arthur Cushny and Alvin Peebles on the effects of two sleep-inducing drugs, given to ten patients at a Michigan asylum, with the extra hours of sleep recorded for each drug against a control night. The ten differences between the two drugs have a mean of 1.58 hours and a standard deviation of 1.23 hours, so
\[ t = \frac{1.58}{1.23/\sqrt{10}} = 4.06. \]With nine degrees of freedom, a value this large arises by chance about three times in a thousand, and Gosset concluded that the second drug was the better soporific. Had he used the normal distribution the p-value would have come out smaller and the conclusion would have looked firmer than it was. Historians later noticed that Gosset had mislabelled which drug was which; the statistics were right and the pharmacology was not. The sleep data are in every statistics package today under his name.
What small samples taught
The t distribution was the start of small-sample statistics, the branch of the subject that admits how little data most people have. Fisher's analysis of variance, his exact test, and the design of experiments all grew from the same soil of agricultural plots and brewery trials, where observations are expensive and few. The large-sample theory of Pearson's school described the census and the anthropometric survey; Gosset's described the laboratory and the field.
He went on to run the Guinness brewery at Park Royal in London, from 1935, and died two years later at 61. The company kept its rule; his obituary in Biometrika was the first time most readers learned who Student had been.
In the Statistics Masterclass, Unit 6 introduces the t distribution with the ten patients and explains, with the shuffled cards, why the interval widens when the standard deviation must be estimated. Unit 7 turns the same quantity into the t-test. The number to remember is 2.26 against 1.96: the price, in standard errors, of not knowing the spread of your data in advance.