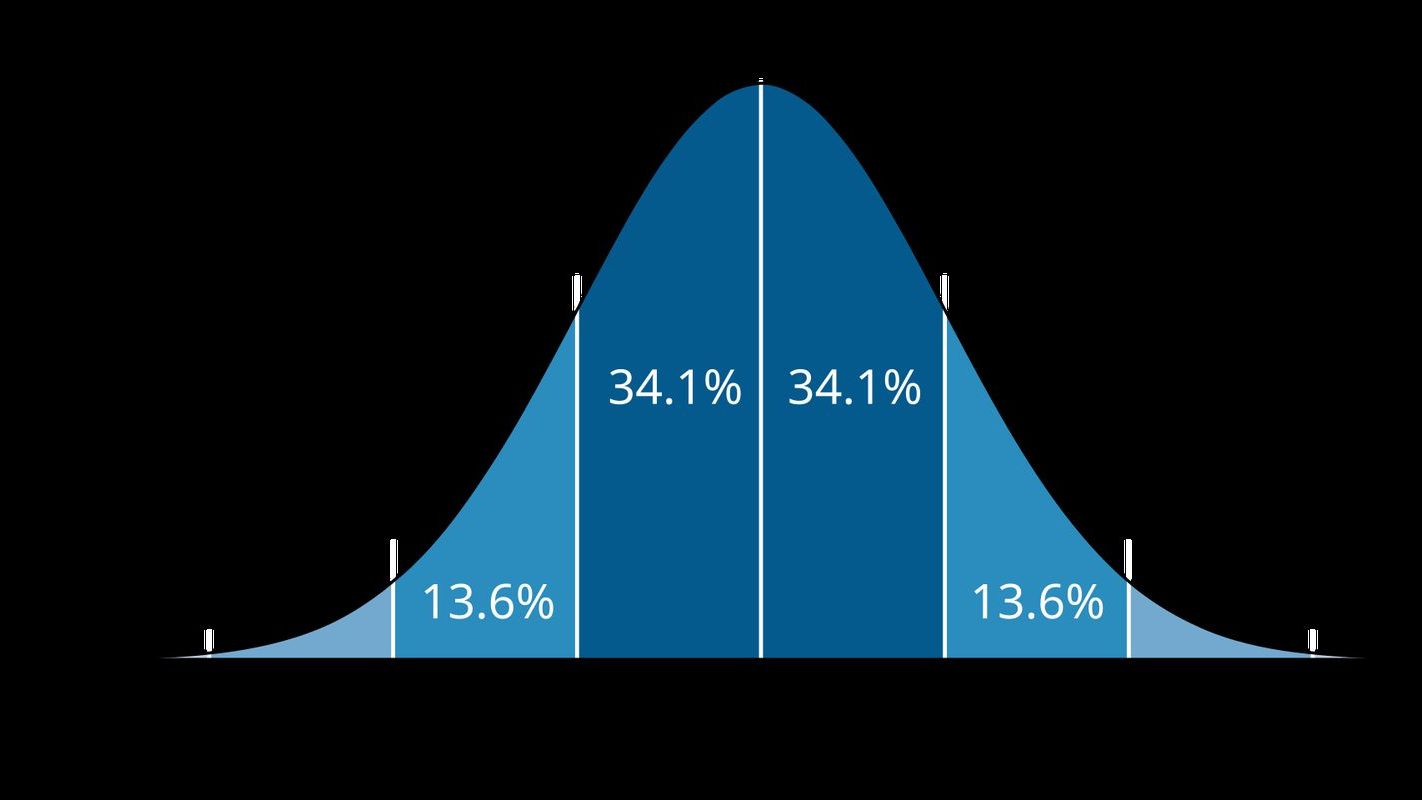
 Image: M. W. Toews, CC BY 2.5
What a p-value is, and what it is not
Toss a coin ten times and get nine heads. Is the coin fair? A p-value is the standard tool for answering that kind of question, it appears in almost every scientific paper, and most people who use it, including many scientists, cannot say exactly what it is. In 2016 the American Statistical Association took the unusual step of publishing a statement on the subject, because the misreadings had become a problem for science. This article gives the definition, the misreadings, and the statement.
The definition
Start with a claim you want to test, called the null hypothesis and written \(H_0\). For the coin, \(H_0\) is that the probability of heads is one half. The p-value is the probability, calculated as if \(H_0\) were true, of getting a result at least as extreme as the one you got.
For nine or more heads in ten tosses of a fair coin, the probability is \((10 + 1)/1024 = 0.011\): ten ways to get exactly nine heads, one way to get ten, out of 1,024 equally likely sequences. If you would have been just as surprised by nine tails, you count both ends and the p-value doubles to 0.021. Either way the number says: a fair coin produces something this lopsided about one time in fifty.
Read the definition again and notice what is fixed and what is random. The hypothesis is fixed; we assume it. The data are what vary. The p-value is a statement about data, given a hypothesis. It is not a statement about the hypothesis, given the data, and the whole trouble comes from reading it as the second when it is the first.
The three misreadings
The first misreading is that a p-value of 0.02 means there is a 2 per cent chance that the null hypothesis is true, or a 98 per cent chance that your finding is real. It does not. The probability that a hypothesis is true, given data, is the quantity Bayes' theorem produces, and to compute it you need to say how plausible the hypothesis was before the data, which the p-value never asks. A p-value of 0.02 for a well-established effect and a p-value of 0.02 for the claim that people can see the future carry the same p-value and very different credibility. Unit 12 of the Statistics Masterclass shows how the prior enters.
The second misreading is that the p-value is the probability that the result arose by chance. The calculation assumes chance alone is operating; it cannot then tell you the probability that chance alone is operating. What it tells you is how often chance alone would produce something this large.
The third is that a p-value above 0.05 shows there is no effect. A large p-value means the data are compatible with the null hypothesis. They are usually compatible with many other hypotheses too, including a real effect that the study was too small to detect. Absence of evidence is not evidence of absence, and a study of 20 people that fails to find a difference has mostly found that 20 people are not enough.
Where 0.05 came from
Ronald Fisher, in his 1925 book Statistical Methods for Research Workers, suggested that a deviation reached by chance only once in twenty trials was a convenient point at which to start taking a result seriously, and he wrote the tables of critical values for that level because the tables of the full distributions were under copyright elsewhere. He treated the level as a rough guide and used others freely. The threshold hardened into a rule in the following decades, when journals began to use it as a publication criterion, and by the 1960s "significant at the 5 per cent level" had become a password.
Fisher also gave the field its most famous illustration. A colleague at Rothamsted, the biologist Muriel Bristol, claimed she could tell whether the milk or the tea had been poured into the cup first. Fisher designed an experiment: eight cups, four of each kind, presented in random order. If she were guessing, the chance of sorting all eight correctly is one in seventy, a p-value of 0.014. The story says she got them all right.
The six principles of 2016
The ASA statement was written by Ronald Wasserstein and Nicole Lazar, who is featured in Unit 7 of the Statistics Masterclass, after a year of argument among two dozen statisticians. It is short, and the full text is free. Its six principles, in plain words:
- A p-value tells you how incompatible your data are with a specified model. Small p-values mean the data would be unusual if the model held.
- A p-value does not measure the probability that the hypothesis is true, nor the probability that the data were produced by chance alone.
- A scientific conclusion or a business or policy decision should not rest only on whether a p-value crosses a threshold.
- Proper inference requires full reporting and transparency. If you ran twenty analyses and report the one with the smallest p-value, the number means nothing.
- A p-value does not measure the size of an effect or the importance of a result. A trivial effect in a huge study gives a tiny p-value; a large effect in a small study may not.
- By itself, a p-value is not a good measure of evidence for or against a hypothesis.
Principle four is the one that bites hardest in practice, and the article on the replication crisis in psychology shows what happens when it is ignored.
What to do instead
The statement did not say to abandon the p-value, and neither does this article. It said to report it as one number among several. Report the size of the effect in its real units: not "the drug significantly lowered blood pressure" but "the drug lowered systolic blood pressure by 4 mmHg". Report a confidence interval, which shows the range of effect sizes compatible with the data and makes the difference between "we found nothing" and "we could not tell" visible. State how many analyses were run. And treat 0.049 and 0.051 as what they are, nearly the same number, rather than as a verdict and an acquittal.
In 2019 three statisticians, Valentin Amrhein, Sander Greenland, and Blake McShane, published a comment in Nature with more than 800 signatories calling for the end of the phrase "statistically significant" altogether, on the grounds that the threshold turns a continuous measure into a false dichotomy. The comment is worth reading whichever side you take. The p-value survives the argument; what is in dispute is the habit of treating it as a switch.
Unit 7 of the Statistics Masterclass works through the coin, the tea, a two-sample comparison, and the chi-squared test, and states at each step what the p-value does and does not say. The most useful sentence in the unit may be the shortest: a p-value is a probability about data, calculated under an assumption, and nothing more.