
Correlation, regression, and causation
Anscombe's quartet and the Datasaurus, regression to the mean in sport and school, Simpson's paradox with the kidney stones, spurious correlations, and the designs that do establish cause.
Articles

What the lasso does to a regression
Add a penalty on the sum of the absolute coefficients to least squares and something unexpected happens: coefficients shrink, and then, one by one, become exactly zero. Robert Tibshirani's method of 1996, the diamond and the circle, and why genomics needed it.

Correlation is not causation, and what is
Countries with more storks have more babies, and a treatment that is better for small stones and better for large stones is worse overall. Confounders and Simpson's paradox explain how, and three kinds of study design explain how a cause can be found at all.
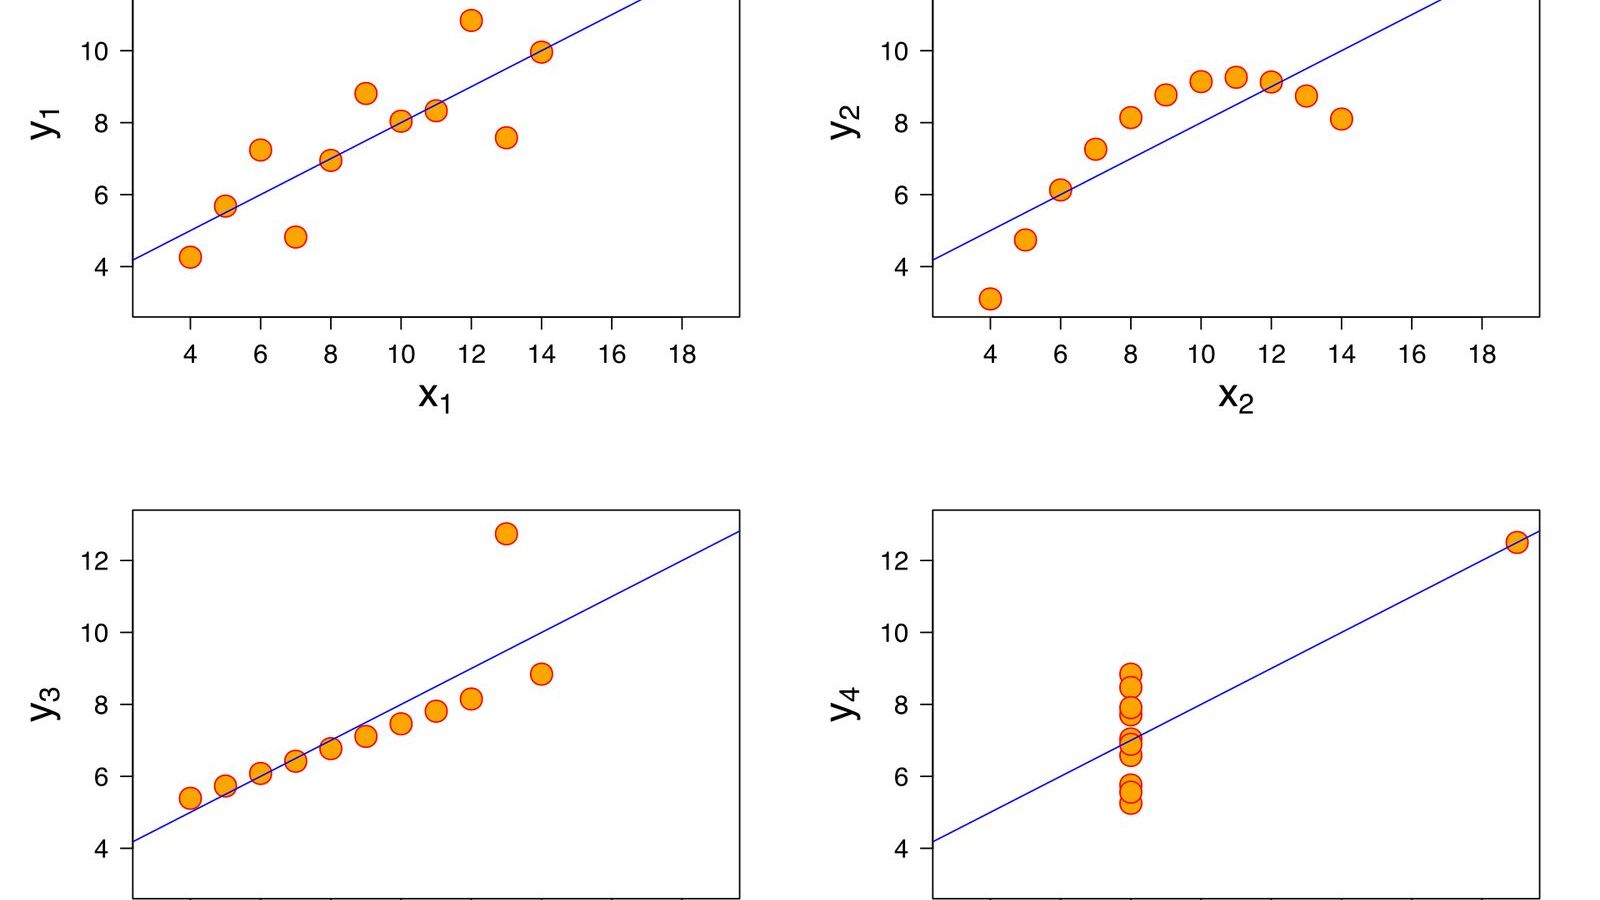
Same statistics, different pictures
Frank Anscombe built four datasets in 1973 with the same means, variances, correlation, and regression line, and plots that look nothing alike. In 2017 a dinosaur made the same point. Why the plot comes before the calculation.
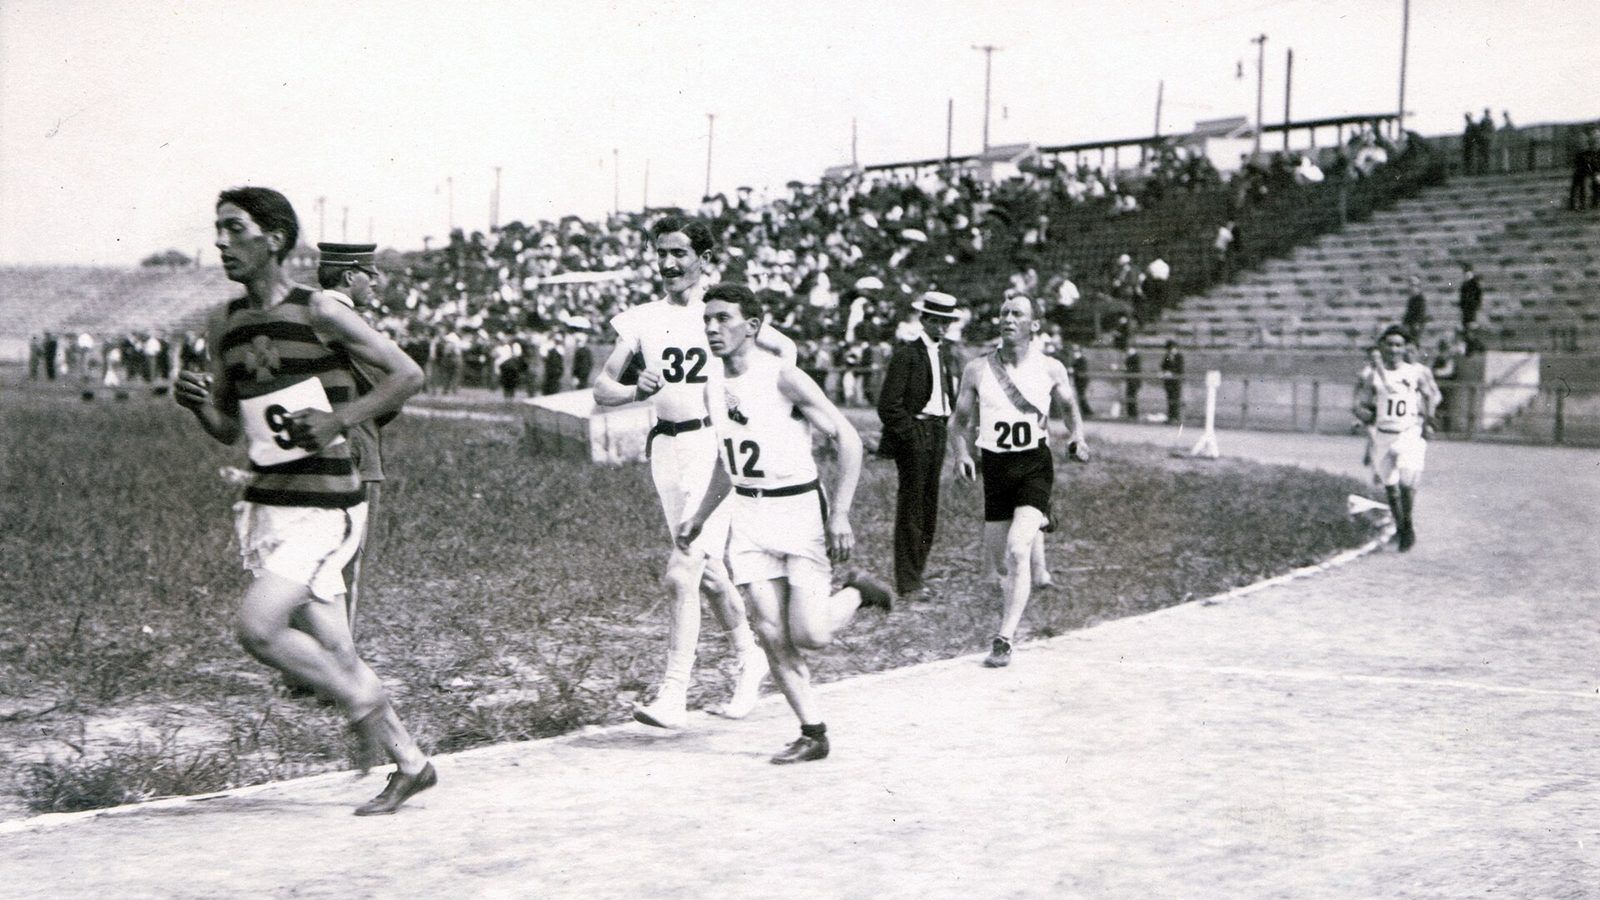
Regression to the mean, the most misread pattern in sport and school
The worst students improve on the retest and the athlete on the magazine cover has a poor season. No cause is needed: whenever a measurement contains chance, extreme values are followed by less extreme ones. Galton found it in 1886, and it is still misread every day.
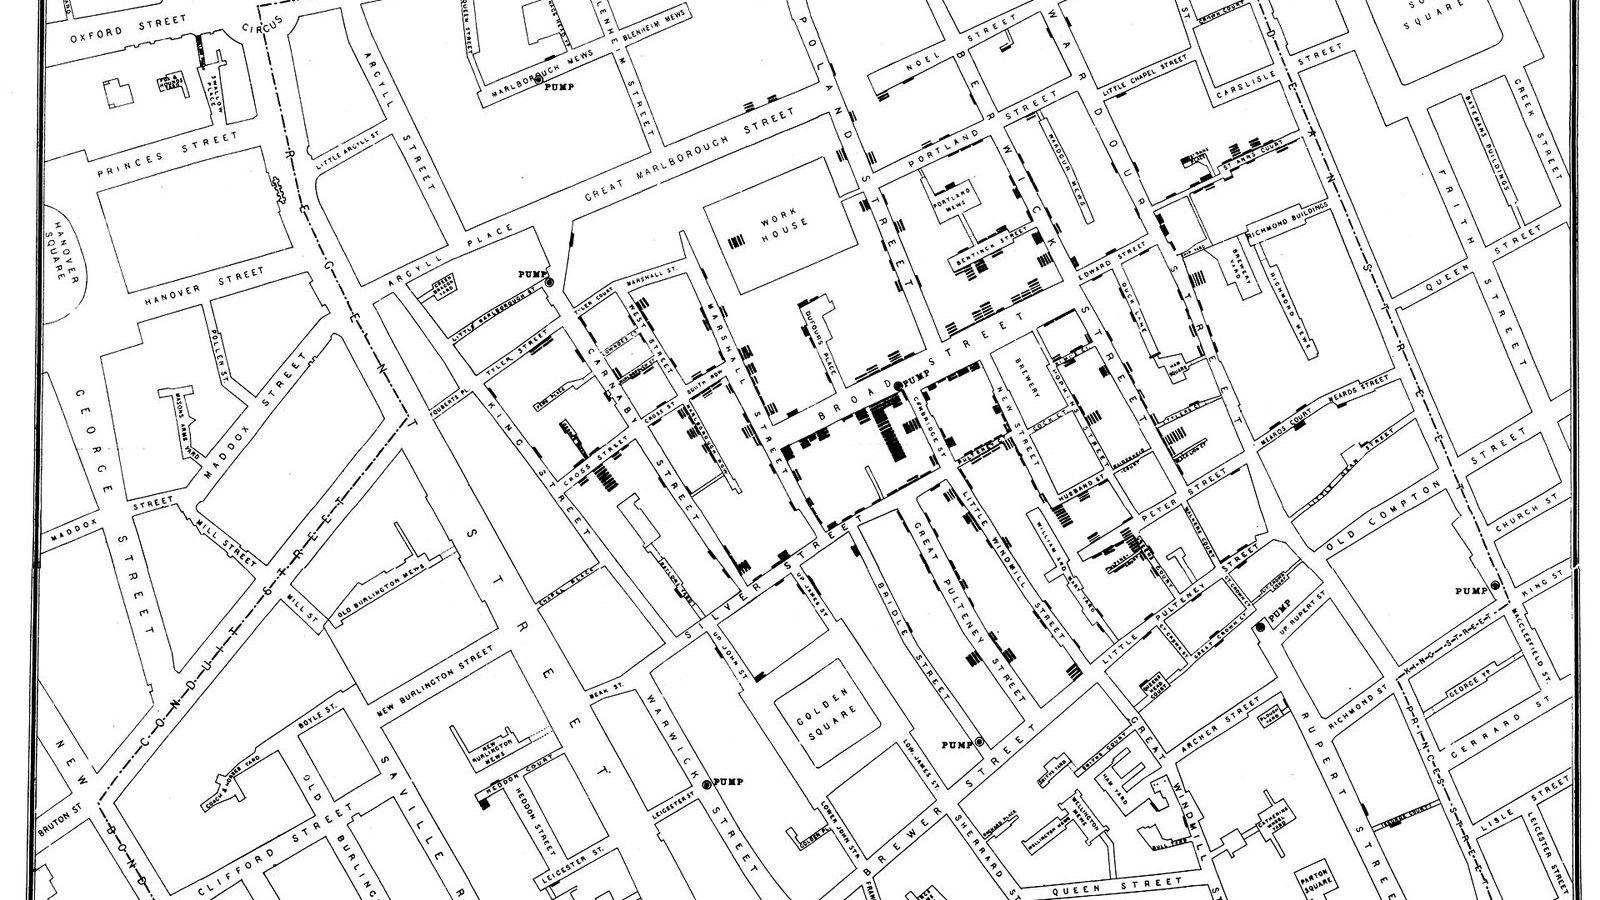
The Broad Street pump and the experiment nobody planned
In 1854 two water companies supplied the same London streets, one of them from the Thames below the city's sewage outlets. John Snow counted 315 cholera deaths per 10,000 houses for one company and 37 for the other, and the comparison became the first natural experiment.
In the masterclass
Describing Distributions
Histograms, box plots, centre, spread, and standardized values
Correlation, Regression, and Causation
Scatter plots, the correlation coefficient, the least-squares line, and what it takes to show a cause
Multiple Regression and Linear Models
Several predictors at once, indicator variables, t and F tests, analysis of variance, and residual checks
Logistic Regression and Generalized Linear Models
Odds and log odds, the logistic curve, fitting by maximum likelihood, Poisson regression, and one framework for all three