 Image: Sarah Stierch, CC BY 4.0
How a poll of 1,000 people can speak for a country
A country of 60 million people, and a polling company asks 1,000 of them. The number strikes most people as absurd: one in sixty thousand. Yet polls of that size have estimated national vote shares to within a few points for ninety years, and the reason is a piece of arithmetic that fits on a postcard. The reason it sometimes fails is a different matter, and this article covers both.
The soup
A cook tastes a spoonful to judge a pot of soup. The spoonful is the same size whether the pot holds two litres or two hundred. What matters is that the soup was stirred, so that the spoonful is like the rest. A sample works the same way. If every person in the country had the same chance of being chosen, the sample is a spoonful of a stirred pot, and its size, not the size of the pot, decides how much it tells you.
That claim sounds like a trick, so here is the calculation behind it.
The formula
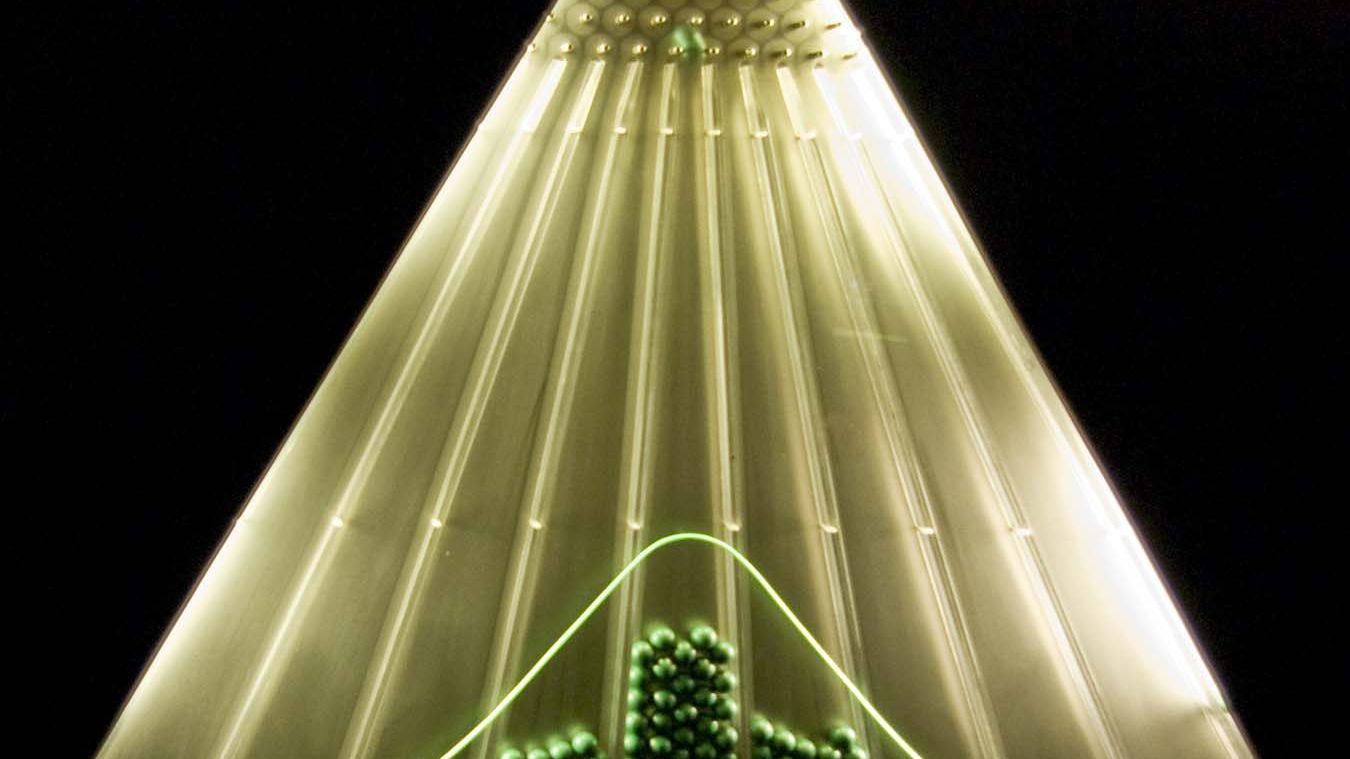
Suppose a proportion \(p\) of all voters support a party, and you ask \(n\) people chosen at random. The proportion in your sample, \(\hat{p}\), will not be exactly \(p\). Its typical distance from \(p\), the standard error, is
\[ \mathrm{SE}(\hat{p}) = \sqrt{\frac{p(1-p)}{n}}. \]For a party near 50 per cent and a sample of 1,000, that is \(\sqrt{0.25/1000} = 0.0158\), or 1.6 percentage points. The sample proportion lies within about two standard errors of the truth in 95 per cent of samples, so the margin of error quoted by the pollster is \(1.96 \times 1.6 = 3.1\) percentage points. A poll that reads 52 to 48 is, by this arithmetic, a tie.
Look at what is in the formula and what is not. The sample size \(n\) is in the denominator under a square root. The population size is absent. A poll of 1,000 in Iceland and a poll of 1,000 in India have the same margin of error. The strict formula does contain a correction for the population size, a factor of \(\sqrt{(N - n)/(N - 1)}\), but for a population of 300,000 and a sample of 1,000 it equals 0.998, and for a larger population it is closer to one still. The soup analogy is exact enough.
Unit 5 of the Statistics Masterclass derives this formula from the variance of a sum of independent draws, and it is free to read if you want the steps.
Why pollsters stop at 1,000
The square root is the reason. To halve the margin of error you must quadruple the sample. Going from 1,000 to 4,000 people brings the margin from 3.1 to 1.5 points; going to 16,000 brings it to 0.8. Each step costs four times as much and buys half as much. Somewhere between 1,000 and 2,000 the arithmetic stops rewarding the pollster, because the other sources of error, the ones the formula does not include, are already larger than the one it does.
The table shows the margin of error for a proportion near 50 per cent at a few sample sizes.
| Sample size | Standard error | 95 per cent margin |
|---|---|---|
| 100 | 5.0 points | 9.8 points |
| 400 | 2.5 points | 4.9 points |
| 1,000 | 1.6 points | 3.1 points |
| 2,000 | 1.1 points | 2.2 points |
| 10,000 | 0.5 points | 1.0 points |
Notice too that the margin quoted applies to the whole sample. A subgroup of 100 people within the poll, say voters under 25, carries a margin of nearly 10 points, and headlines about what young voters think are usually built on exactly such a subgroup.
What the formula assumes
The arithmetic rests on one assumption: that the sample is a simple random sample, meaning every person had the same chance of being chosen and the choices were independent. No real poll achieves that, and the distance between the ideal and the practice is where polls go wrong.
First, there must be a list to draw from. Random-digit dialling of telephones was the standard from the 1970s; it now misses people without a phone and reaches people who do not answer. Online panels recruit volunteers, who are not a random draw of anything. Pew Research Center's methods pages describe how a modern survey is actually drawn, with addresses sampled from postal lists and respondents invited by mail.
Second, most people refuse. Response rates to telephone polls in the United States fell from about 36 per cent in 1997 to under 10 per cent two decades later. If the people who refuse differ from those who answer in how they vote, the sample is biased, and no formula fixes bias. This was the undoing of the Literary Digest in 1936, and it was the main finding of the inquiry into the 2020 United States polls, which overstated the Democratic vote by about four points on average, the largest error in forty years, apparently because the voters who agreed to be interviewed were not like those who did not.
Third, pollsters correct for all this by weighting. If the sample has too few men without a university degree, each such respondent is counted a little more than once. Weighting reduces bias and increases variance, so the effective sample size after weighting is smaller than the headcount, and good pollsters report a margin of error adjusted for it, typically a point or so larger than the textbook formula gives.
What the margin of error does not cover
The published margin covers sampling error only, the error that comes from asking 1,000 people rather than everyone. It does not cover a biased frame, nonresponse, the wording of the question, the order of the questions, people who change their minds between the poll and the election, or people who say they will vote and do not. Pew's short explainer on the margin of error in election polls makes this point with the 2016 polls, and the 2016 and 2020 misses were both of this second kind.
So the right reading of "52 per cent, margin of error 3 points" is: if the sample were a stirred spoonful of the country, the true figure would lie between 49 and 55 in 19 polls out of 20. The sample is not quite a stirred spoonful, and the pollster has done what can be done about it. The average of several polls is usually better than any one of them, because their non-sampling errors partly cancel; their shared errors, such as a whole industry underestimating one kind of voter, do not cancel at all.
Unit 5 of the Statistics Masterclass derives the standard error and shows it at work on real height data, and Unit 6 turns it into the confidence interval and spends a careful page on what that interval does and does not promise. The dataset of the week for Unit 6 is the European Social Survey, where you can compute a margin of error for a real question in a real country and check it against the one the survey publishes.