
Polls, samples, and the normal curve
How a poll of 1,000 people can speak for a country, why 2.4 million ballots got an election wrong, what the margin of error assumes, and why so many measurements are bell-shaped while some never are.
Articles

What the lasso does to a regression
Add a penalty on the sum of the absolute coefficients to least squares and something unexpected happens: coefficients shrink, and then, one by one, become exactly zero. Robert Tibshirani's method of 1996, the diamond and the circle, and why genomics needed it.
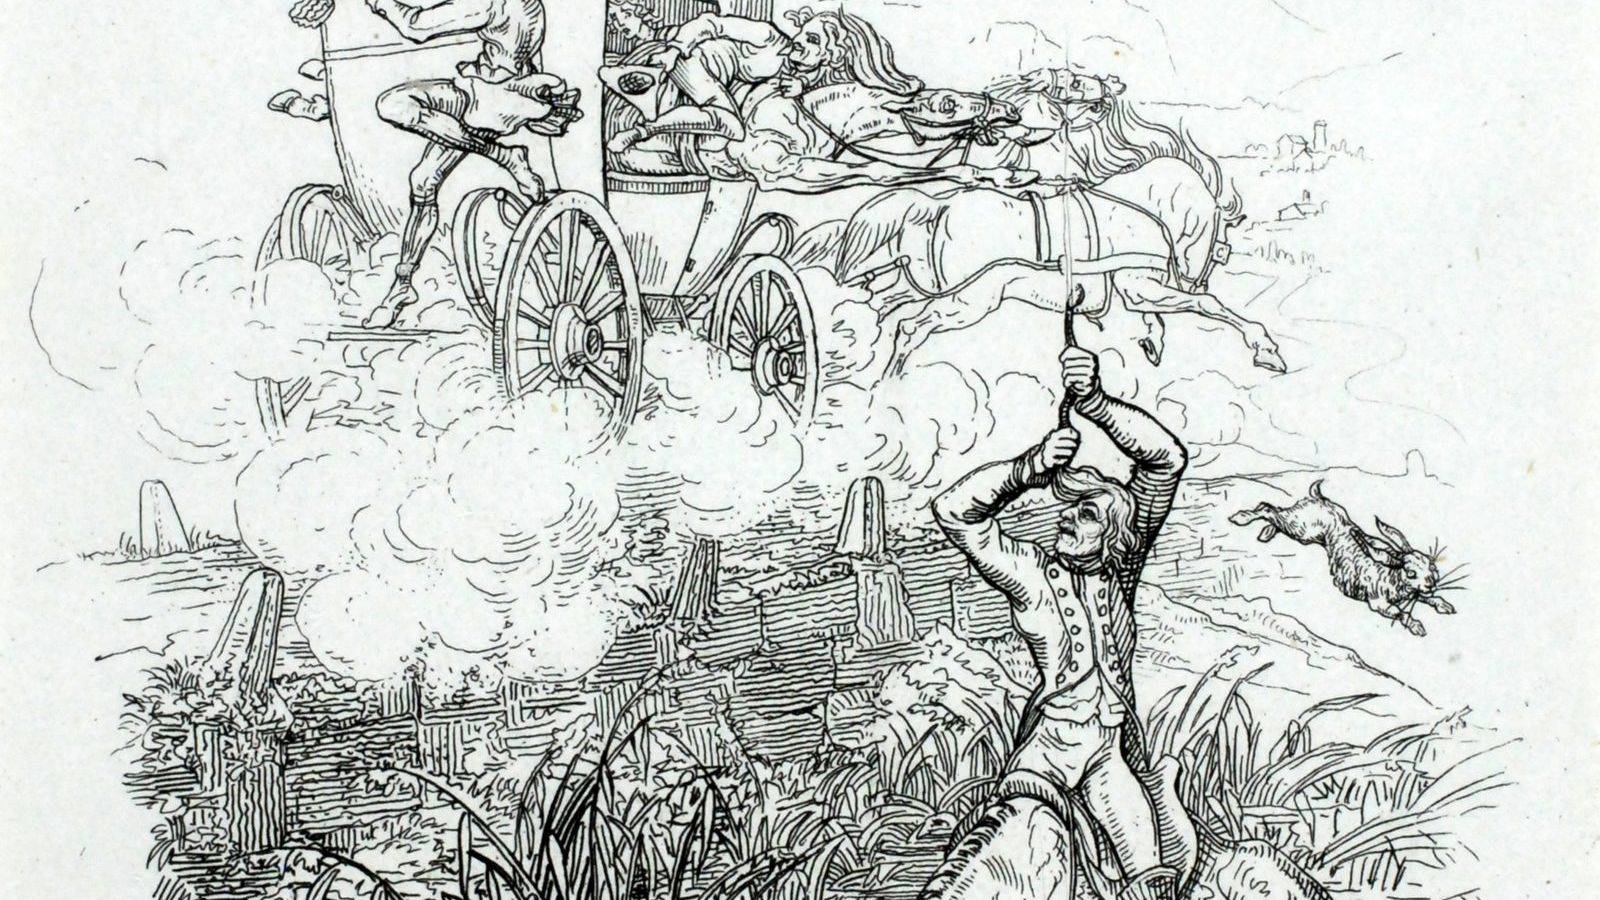
The bootstrap in one page
Draw your own sample again and again, with replacement, and compute the statistic each time. The spread of the results is the standard error you could not derive. Bradley Efron's method of 1979 explained, with the reason 37 per cent of the data sit out of every resample.

Why so many things are bell-shaped, and why some are not
Heights, measurement errors, and exam scores follow the bell curve. City sizes, earthquakes, and fortunes do not. The central limit theorem explains the first group, and a different kind of arithmetic explains the second.
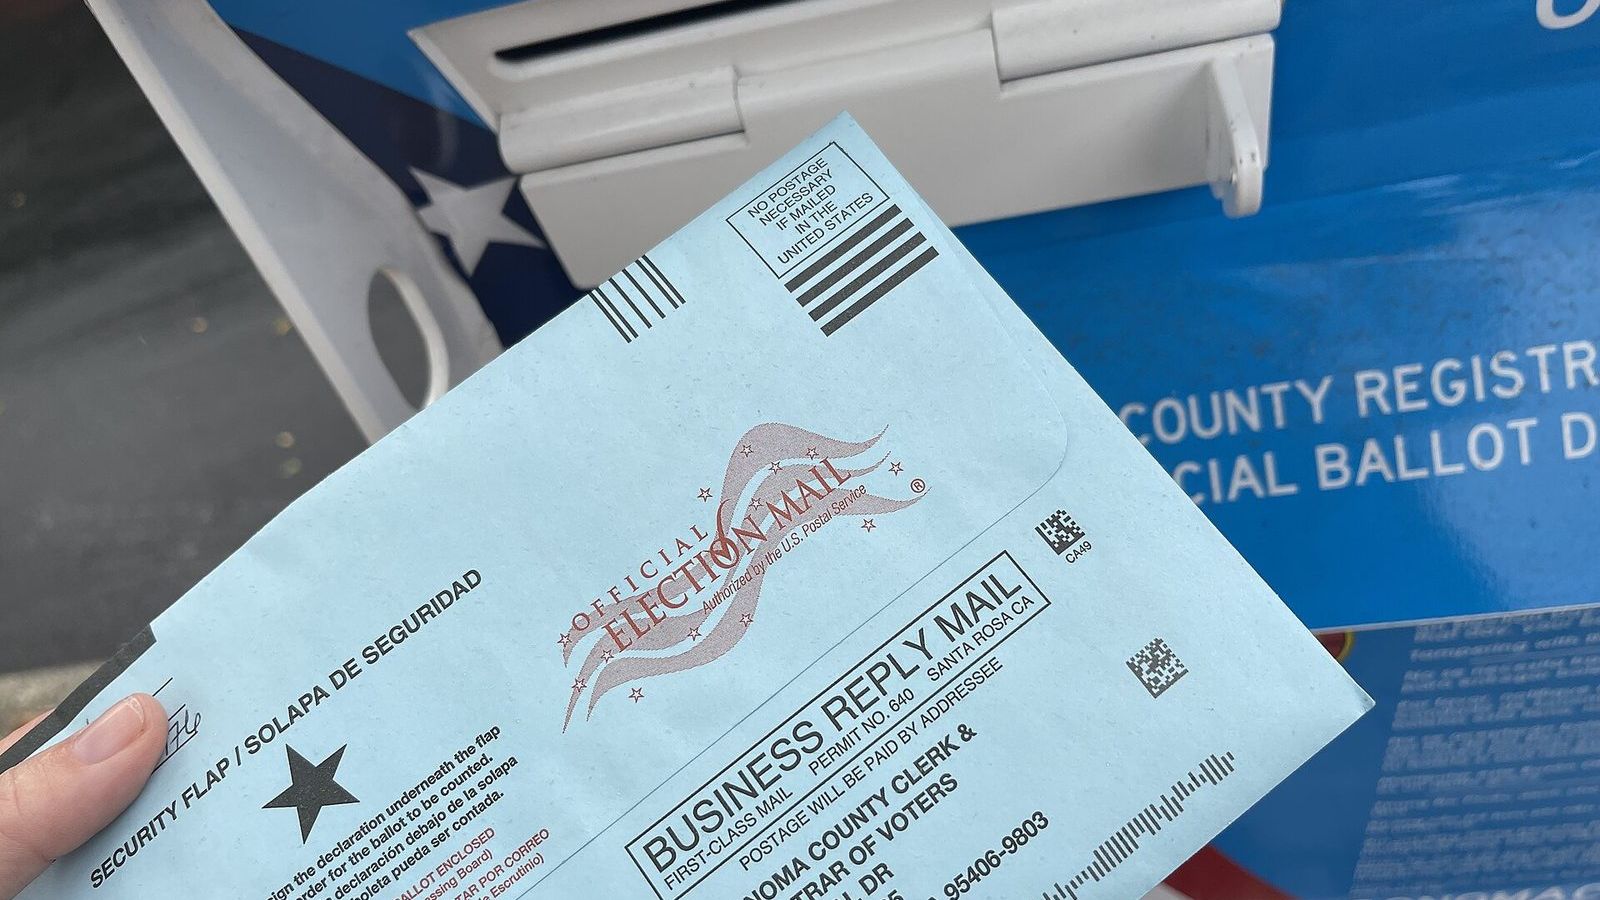
How a poll of 1,000 people can speak for a country
A random sample of 1,000 people estimates a proportion to within about 3 percentage points, whether the country has 300,000 inhabitants or 300 million. Here is the arithmetic, what it assumes, and what the margin of error leaves out.
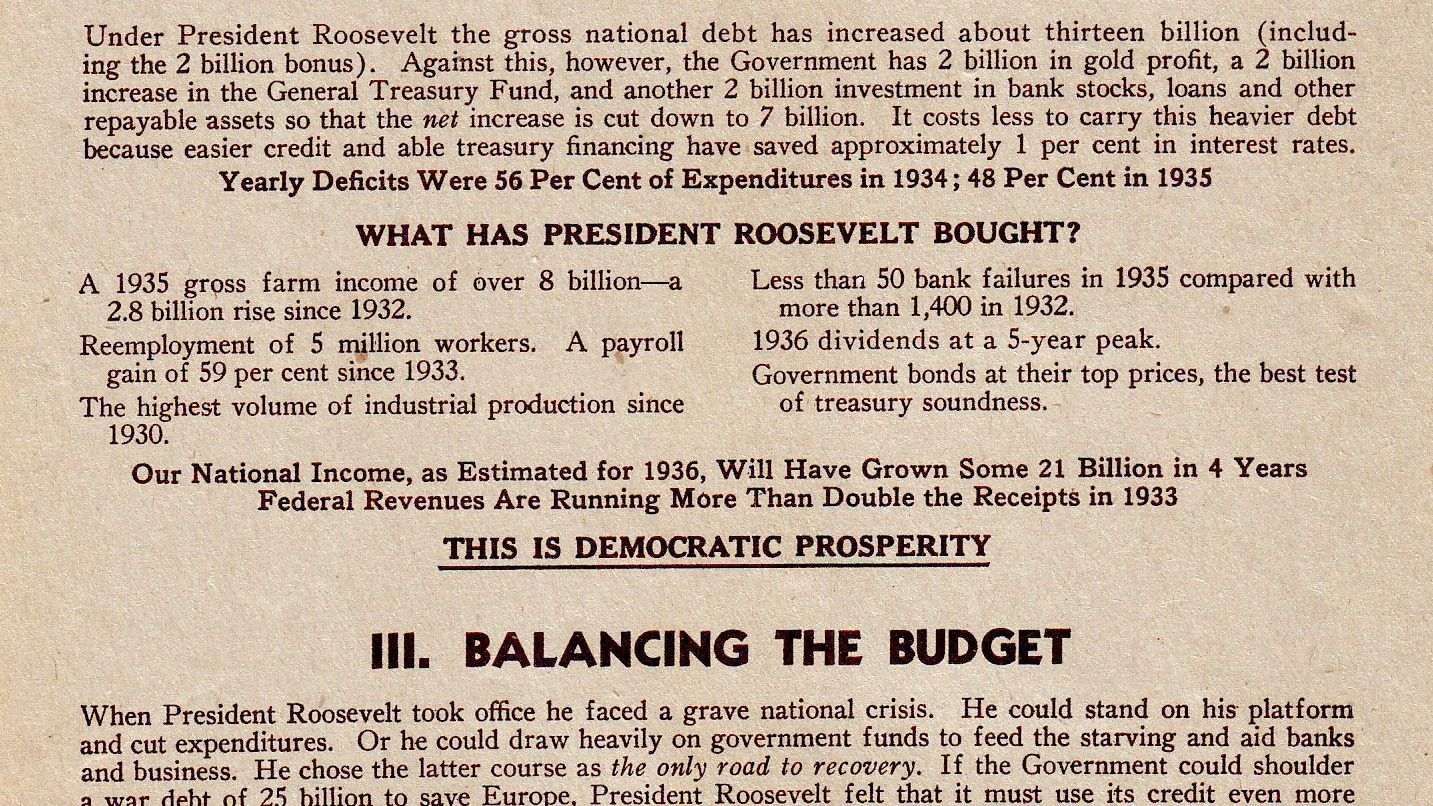
Why 2.4 million ballots got the 1936 election wrong
The Literary Digest collected 2.4 million mailed ballots and forecast a clear win for Alf Landon. Franklin Roosevelt won 46 of 48 states. A short history of sampling bias, and of the much smaller polls that called the result correctly.