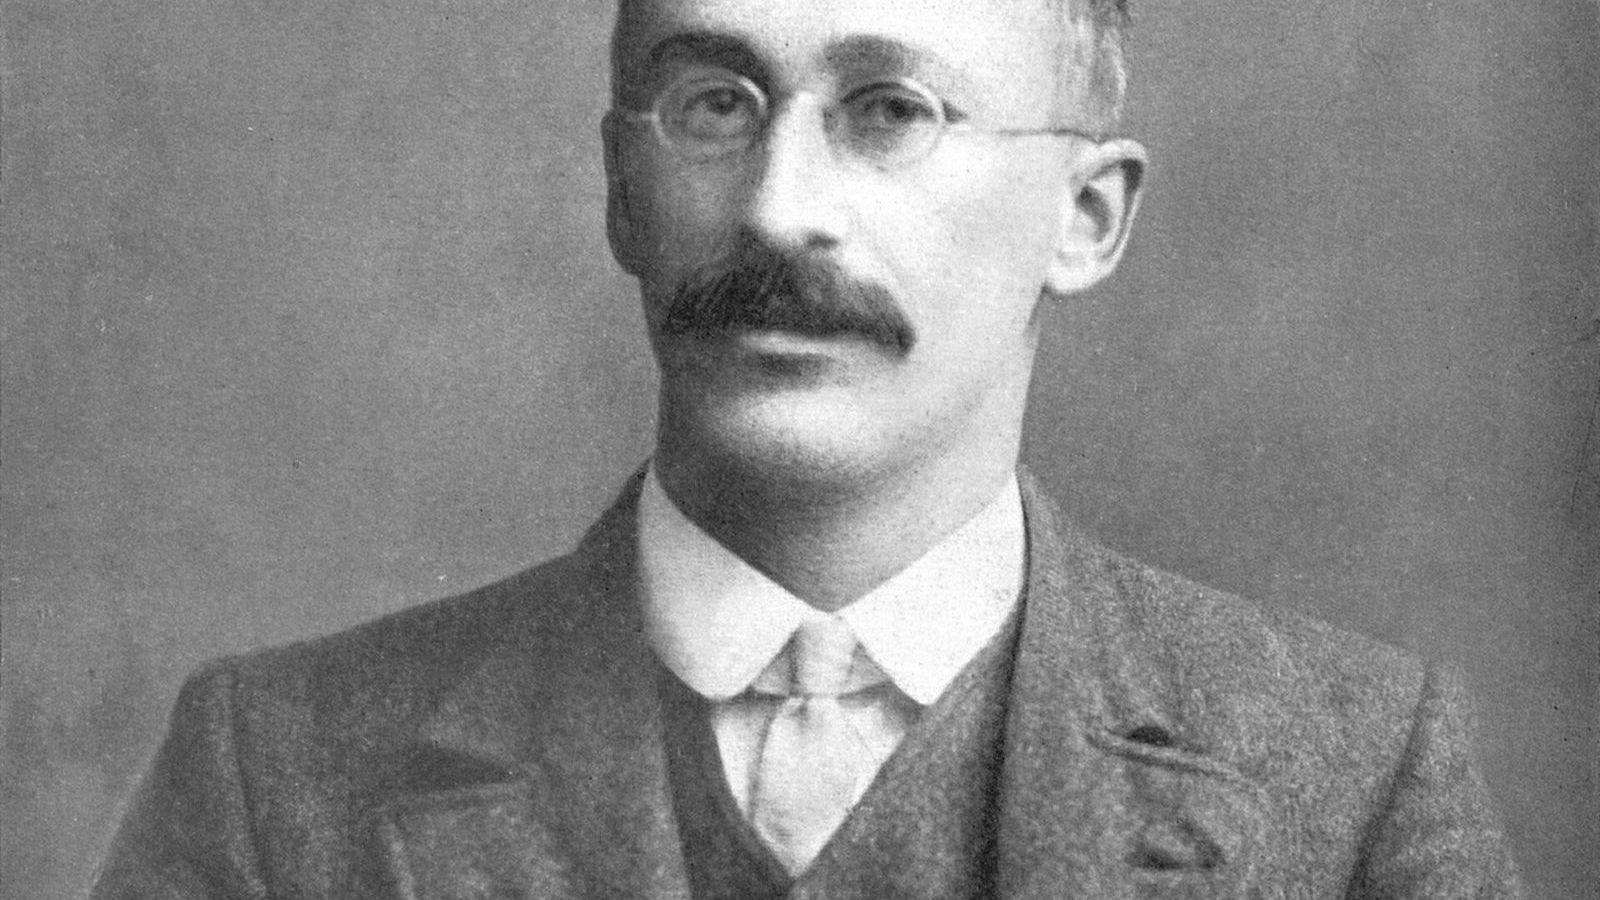
 Image: Florence Nightingale, 1858, public domain
Florence Nightingale's rose
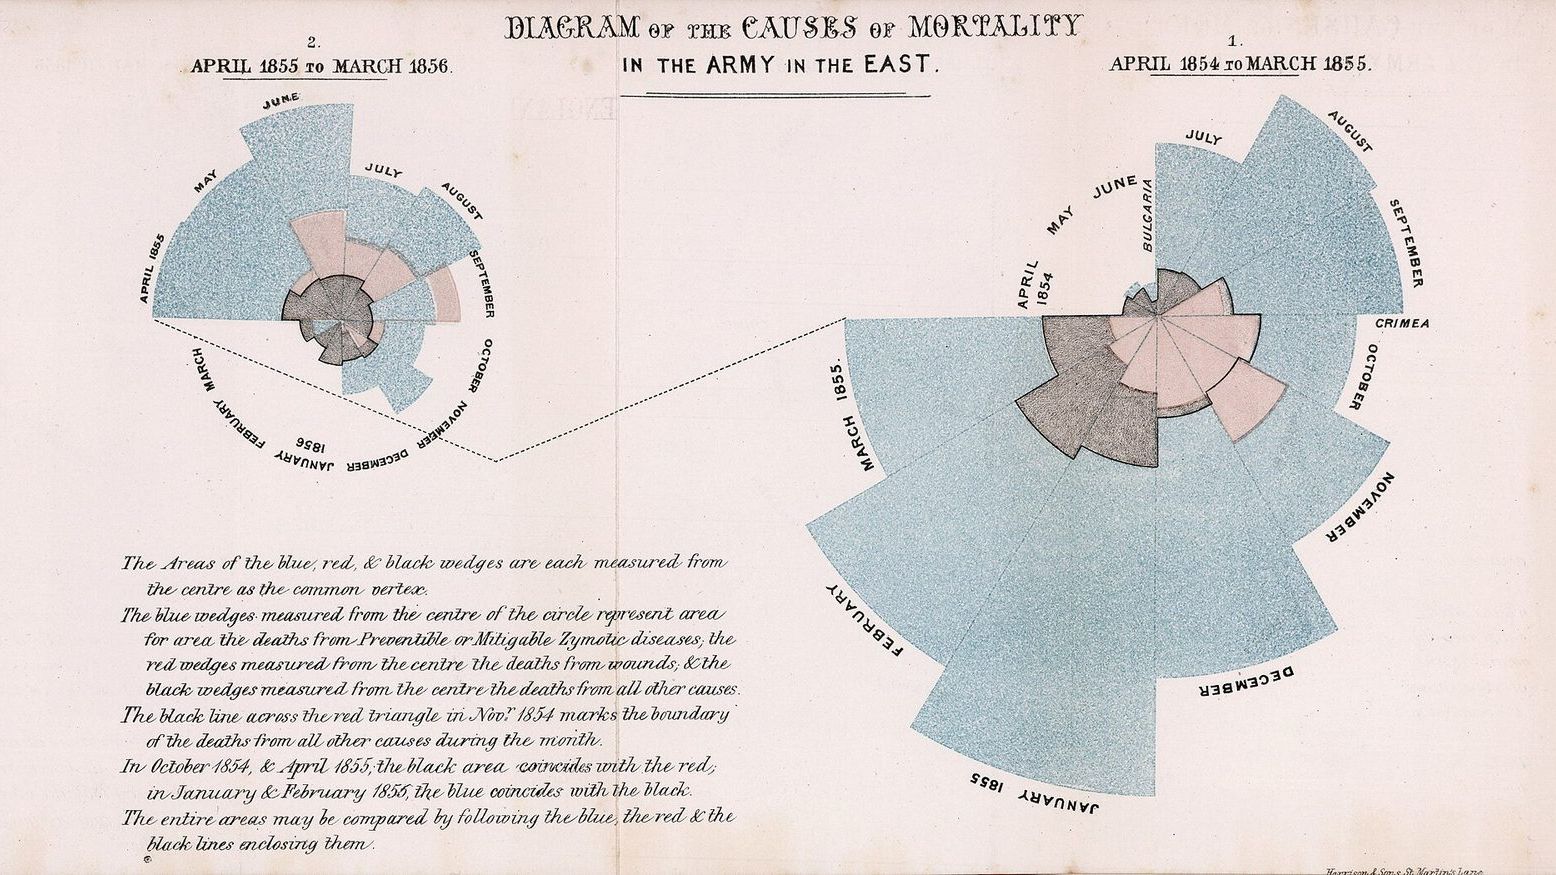
In January 1855, in the British army hospitals of the Crimean War, 2,761 soldiers died of infectious disease, 83 of wounds, and 324 of other causes. The army in the field numbered about 32,000. At that rate of dying, the whole force would have been dead within a year. Florence Nightingale, who had arrived at the Scutari hospital with 38 nurses the previous November, counted these deaths, and after the war she drew them.
The diagram
The drawing she published in 1858, in a report to the Royal Commission on the health of the army, is the one now called the rose diagram, or the coxcomb, though she used neither name. It consists of two circles, one for each year of the war from April 1854 and from April 1855, each divided into twelve wedges for the months. The area of each wedge is proportional to the number of deaths in that month. Blue, the outermost, is deaths from what the Victorians called zymotic disease, the infections: cholera, typhus, dysentery. Red is deaths from wounds. Black is everything else.
The picture makes one point with no help from the reader. In the first year the blue dwarfs everything. January 1855, the month with the figures above, is a blue wedge that reaches almost to the edge of the page while the red sliver inside it is barely visible. In the second year, after the Sanitary Commission had arrived in March 1855 and cleaned the sewers, flushed the drains, and ventilated the wards, the blue shrinks month by month until it is smaller than the black.
Nightingale's own caption says that the areas, measured from the centre, represent the deaths, and that is how the diagram should be read: by area, not by the length of the wedge. She had an earlier version drawn with the radius proportional to the deaths, realized that this exaggerated the large months, and had it redrawn, which is more care than many chart makers take today.
How to read a polar area chart, and why statisticians rarely draw one
A polar area chart is a bar chart wrapped around a circle. Each wedge is a bar; its angle is fixed, one twelfth of the circle for a month, and its area carries the value. Since area grows with the square of the radius, a wedge with four times the deaths reaches twice as far from the centre. The reader's eye, which judges length better than area, sees twice as far and underestimates the difference.
That is the first weakness of the design. The second is that the wedges share a centre and the inner colours sit inside the outer ones, so the black and red areas are partly hidden and hard to compare across months. A statistician drawing the same data today would use twelve bars in a row, perhaps stacked, with time running left to right, and the differences would be read correctly at a glance. Unit 1 of the Statistics Masterclass makes exactly this comparison and asks what the rose does that the bars do not.
What it does is this: it is memorable, it fits two years of data on a single page, it puts the terrible first winter where the eye goes first, and it was designed for an audience of politicians and generals who were not going to read a table. Nightingale knew her readers. She sent the diagram, with the report, to Queen Victoria, to the Prime Minister, and to every member of the Royal Commission, and she had copies framed. It worked. The Army Medical School was founded in 1860, army barracks and hospitals were rebuilt, and the peacetime death rate of soldiers, which she had also calculated and found to be roughly double that of civilians of the same age, fell.
Where the numbers came from
The counting was Nightingale's own. The army's records at Scutari were kept in several incompatible systems, and she found that the three registers of deaths disagreed with each other. She established a uniform register, and after the war she worked with William Farr, the statistician of the General Register Office and the leading epidemiologist of the day, to turn the counts into rates per 1,000 of strength per year, which is the only form in which the deaths of different months with different numbers of soldiers can be compared. The 2,761 disease deaths of January 1855 correspond to an annual rate of about 1,023 per 1,000: more than the whole army, per year.
This insistence on the rate, with its denominator, is the part of her work that statisticians most admire. The diagram is a drawing of rates, and the rate is what made the comparison between the two years, and between the army and the civilian population, possible. Farr, who was a convinced believer in the miasma theory of disease, nevertheless taught her how to argue from numbers, and she did it better than he did.
One qualification belongs here. Nightingale attributed the fall in deaths to the sanitary reforms, and the timing supports her, but the second winter was also milder, the army was better supplied, and the cholera epidemic that had swept Europe in 1854 had passed its peak. A before-and-after comparison cannot separate these, and she had no control group. Her conclusion was almost certainly right; the diagram does not prove it on its own, and she would have been the first to say that the right experiment could not be done.
The Statistical Society
In 1858 the Statistical Society of London, now the Royal Statistical Society, elected Nightingale its first woman Fellow. In 1874 the American Statistical Association made her an honorary member. She corresponded with Adolphe Quetelet, whose Physique sociale she annotated heavily, and she tried for years to endow a chair of applied statistics at Oxford, so that the men who would run the Empire might learn to read a table. Oxford declined. She called statistics the most important science in the world, on the grounds that it was the only way to know whether anything one did had any effect.
She lived until 1910 and spent most of the second half of her life in bed, writing. The Florence Nightingale Museum at St Thomas' Hospital in London holds her papers and the original diagrams, and its website is the best starting point for her statistical work.
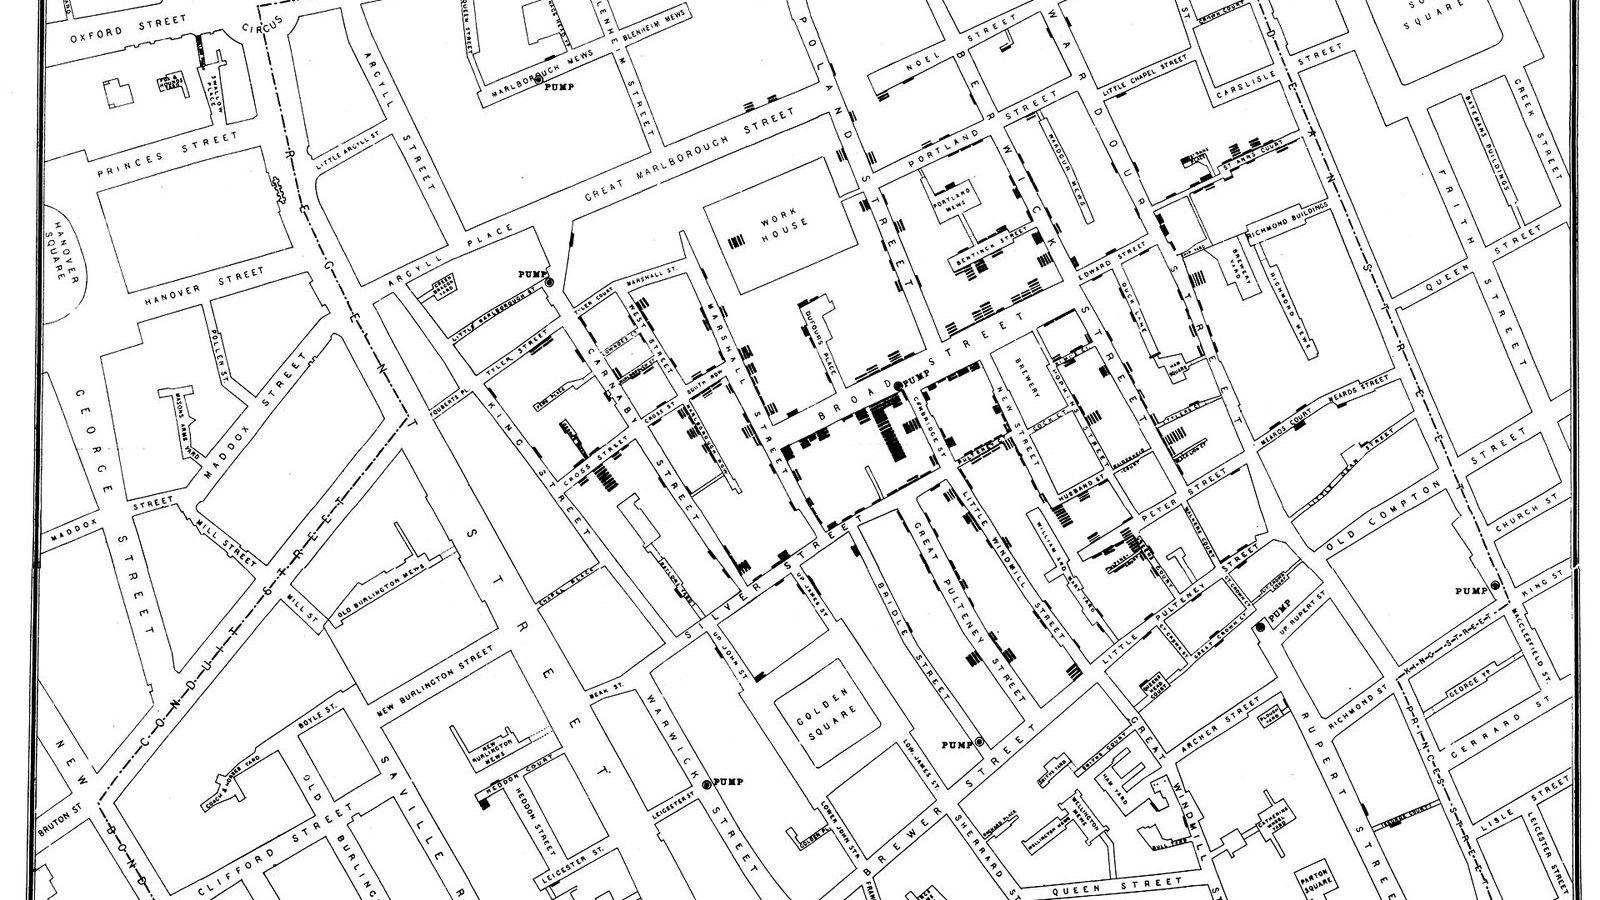
The Statistics Masterclass opens Unit 1 with her diagram, alongside John Snow's cholera map and Charles Minard's chart of the Russian campaign, as the first examples of what a graph is for. The unit's rules for an honest graph, the stated denominator, the zero on the axis, the comparison the eye can make, are the rules her diagram mostly follows and occasionally bends, and learning to see both is the point of the exercise.