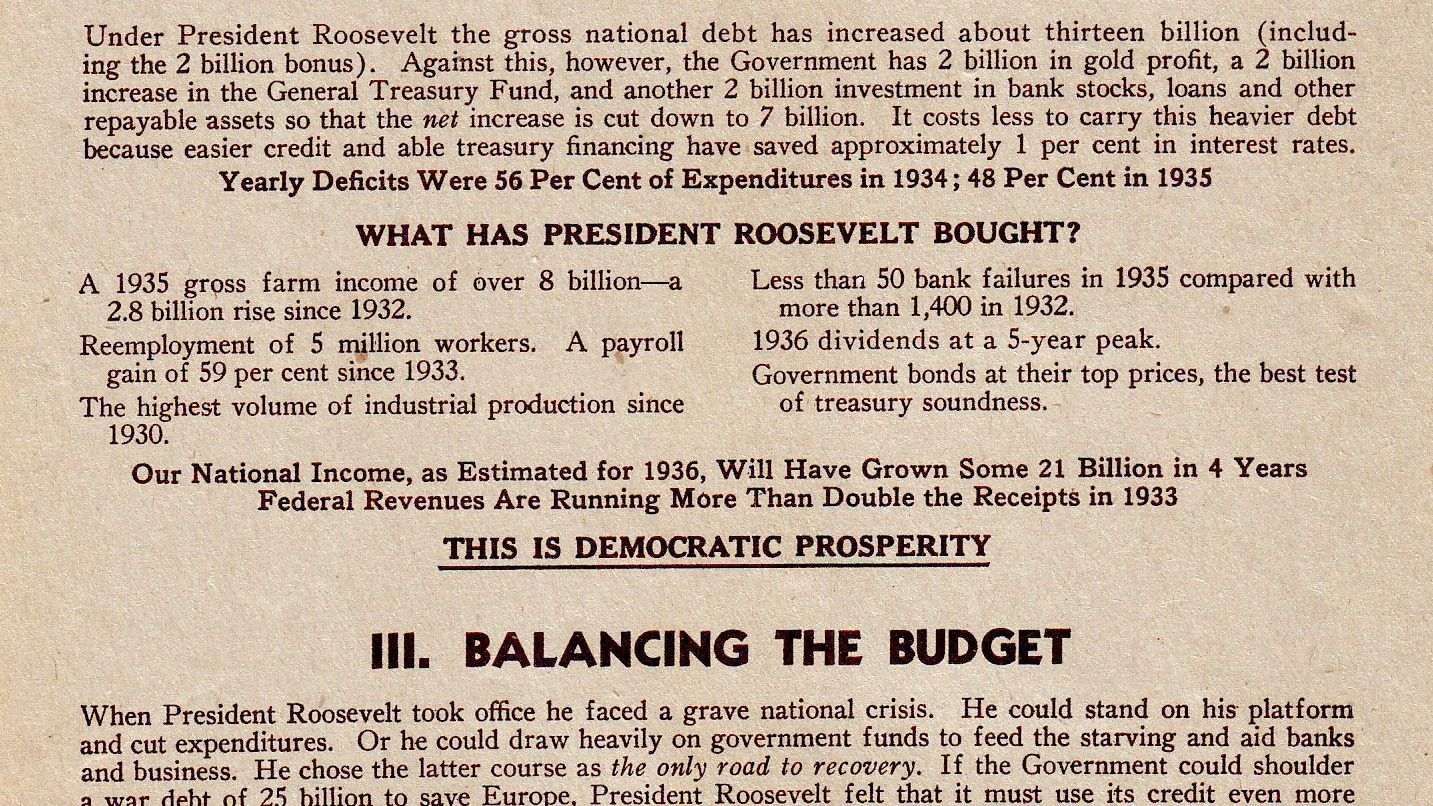
 Image: Democratic National Campaign Committee, 1936, public domain
Why 2.4 million ballots got the 1936 election wrong
In the autumn of 1936 the Literary Digest, a weekly magazine with a circulation in the millions, mailed about 10 million postcard ballots to American voters and asked whom they would vote for in November. It received 2,376,523 back. On that basis it announced that Governor Alf Landon of Kansas would win the presidency with 57 per cent of the vote against 43 per cent for Franklin Roosevelt. Roosevelt won with 60.8 per cent of the popular vote and carried 46 of the 48 states.
The magazine had used the same method in every presidential election since 1916 and had called all five correctly, 1932 within a percentage point. It folded in 1938. The poll is now the first example in almost every statistics course, and it deserves to be, because it shows the one thing about sampling that people find hardest to believe: a biased sample does not get better as it gets bigger.
Where the addresses came from
The Digest built its mailing list from the sources it had: its own subscribers, telephone directories, and lists of car owners. In 1936, in the seventh year of the Depression, about four households in ten had a telephone and fewer owned a car. Both were markers of income, and income was the dividing line of that election in a way it had not been in 1932. Roosevelt's support came disproportionately from people who had neither. A sample drawn from telephone books was a sample of the better off, and the better off favoured Landon.
This is selection bias: the mechanism that chose who was asked was correlated with the answer. It had been present in the Digest's earlier polls too, but in 1920 or 1928 the rich and the rest voted similarly enough for it not to matter. In 1936 it did.
Who bothered to reply
The second bias was larger, and it was only measured properly fifty years later. Of the 10 million people who received a ballot, fewer than a quarter sent it back. Returning a postcard is a small effort, and people who are angry with the government make it more readily than people who are content. In 1937 George Gallup's organization asked a national sample whether they had received a Digest ballot and whether they had returned it, and the political scientist Peverill Squire analysed those answers in 1988. Among people who had received a ballot, Landon supporters had been considerably more likely to return it than Roosevelt supporters. Squire concluded that even if the Digest had mailed its ballots to a perfectly representative list, the people who replied would still have given Landon a majority.
Nonresponse bias is the harder of the two to fix, because you cannot look up the people who did not answer. Every poll today faces it; response rates to telephone surveys in the United States have fallen below 10 per cent, and the whole craft of modern polling consists of correcting for who answers and who does not.
Why size did not help
Here is the arithmetic that makes the story worth telling. If the Digest's 2.4 million replies had been a simple random sample of voters, the standard error of its estimate would have been
\[ \sqrt{\frac{0.5 \times 0.5}{2{,}376{,}523}} = 0.0003, \]three hundredths of a percentage point. A sample that large cannot be off by 20 points through chance. It can be off by 20 points through bias, because bias does not shrink with \(n\). The formula for the standard error assumes that every voter had the same chance of ending up in the sample, and in the Digest's poll some voters had a high chance and others, the ones without telephones or the ones who threw the card away, had almost none. Once that assumption fails, the 2.4 million buy precision about the wrong population.
Xiao-Li Meng, the Harvard statistician featured in Unit 5 of the Statistics Masterclass, put the point into a formula in 2018. The error of an estimate from any sample, random or not, is the product of three things: how strongly the chance of being included correlates with the answer, how large the population is relative to the sample, and how variable the answer is. For a true random sample the first factor is essentially zero and the error is tiny. For the Digest it was not zero, and Meng showed that a non-random sample of 2.4 million can carry no more information than a random sample of a few hundred. His paper's title calls this the big data paradox: the bigger the data, the surer we are of the wrong answer.
The polls that got it right
Three younger pollsters, George Gallup, Elmo Roper, and Archibald Crossley, called the election for Roosevelt that year with samples of a few tens of thousands. Gallup's American Institute of Public Opinion used quota sampling: interviewers were sent out with instructions to find so many men and women, so many in each age group and income bracket, so that the sample matched the census in these respects. Gallup also did something bolder. Before the Digest had published its final figures, he predicted from a sample of 3,000 people drawn from the same kind of lists what the Digest's own poll would say, and he was close. He wrote the prediction up in his syndicated column, and the Digest's editor called it impertinent.
Gallup's own forecast of 56 per cent for Roosevelt was five points low, which by today's standards is a poor poll. Quota sampling has a bias of its own: the interviewer chooses whom to approach within each quota, and interviewers approach people who look approachable. In 1948 that bias caught Gallup, Roper, and Crossley together, and all three predicted that Thomas Dewey would beat Harry Truman. After that the industry moved to probability sampling, in which the choice of who is asked is made by a random mechanism and not by a person, and the standard error formula finally applied.
What the Digest teaches in 2026
Properly drawn samples of about 1,000 people have described national opinion within a few points in most elections since 1936, so the Digest's failure says little about polling in general. What it does show is where the error comes from. A random sample of 1,000 has a margin of error of about 3 percentage points, and the article on how a poll of 1,000 can speak for a country works out why. A self-selected sample of 2 million has no margin of error in that sense at all, because the formula that produces one does not apply.
Every online poll in which readers click to vote is a Literary Digest poll, and so is every customer survey answered only by the furious and the delighted, and so is a dataset of millions of social media posts used to measure what a country thinks. The size is impressive and irrelevant. The question to ask is always the same one: who had a chance to be in these data, and did that chance depend on the answer?
Unit 5 of the Statistics Masterclass, which is free to read, opens with the Digest and goes on to what a random sample does that a large one cannot. Unit 6 adds the margin of error and what it leaves out.