 Image: Marc Auledas, CC BY-SA 4.0
A positive test is not a diagnosis
A woman of 50 with no symptoms has a routine mammogram and the result is positive. The test detects about 90 per cent of breast cancers, and it gives a false alarm in about 9 per cent of women who do not have cancer. What is the probability that she has cancer?
When the psychologist Gerd Gigerenzer and his colleague Ulrich Hoffrage put this question to physicians in the 1990s, most answered between 70 and 90 per cent. The correct answer is about 9 per cent. The physicians were not bad at their jobs; they had been given the information in the form that makes the calculation hard, and this article is about the form that makes it easy.
Three numbers, and the one people forget
A test has two accuracy figures. Its sensitivity is the proportion of people with the disease who test positive, 90 per cent in the example. Its specificity is the proportion of people without the disease who test negative, 91 per cent here, so the false-positive rate is 9 per cent. Both describe the test.
The third number describes the population: the prevalence, the proportion of people being tested who have the disease. For breast cancer among women of 50 with no symptoms it is about 1 per cent. This is the number the physicians were given and did not use, and it is the number that decides everything, because a 9 per cent false-positive rate applied to the 99 per cent who are healthy produces far more positives than a 90 per cent detection rate applied to the 1 per cent who are ill.
The array of 1,000 people
Take 1,000 women of 50 and follow them through the test.
- About 10 have breast cancer. The test finds 9 of them; 1 is missed.
- About 990 do not. The test clears 901 of them and gives a false alarm to 89.
So 98 women test positive: 9 with cancer and 89 without. The probability that a woman with a positive test has cancer is \(9/98\), about 9 per cent. Ten positive results, nine false alarms.
Presented this way, as counts in a group of 1,000, the problem is a matter of two divisions, and in Hoffrage and Gigerenzer's study the share of physicians who got it right rose from about one in ten to about half. Natural frequencies, as this format is called, work because they carry the prevalence inside the numbers. The percentages leave it out and make you remember to put it back.
Bayes' theorem says the same thing in symbols:
\[ \mathrm{P}(\text{cancer} \mid \text{positive}) = \frac{\mathrm{P}(\text{positive} \mid \text{cancer})\,\mathrm{P}(\text{cancer})}{\mathrm{P}(\text{positive})} = \frac{0.90 \times 0.01}{0.90 \times 0.01 + 0.09 \times 0.99} = 0.092. \]The formula and the array are the same calculation. The array is the one you can do standing up.
The same test, a different population
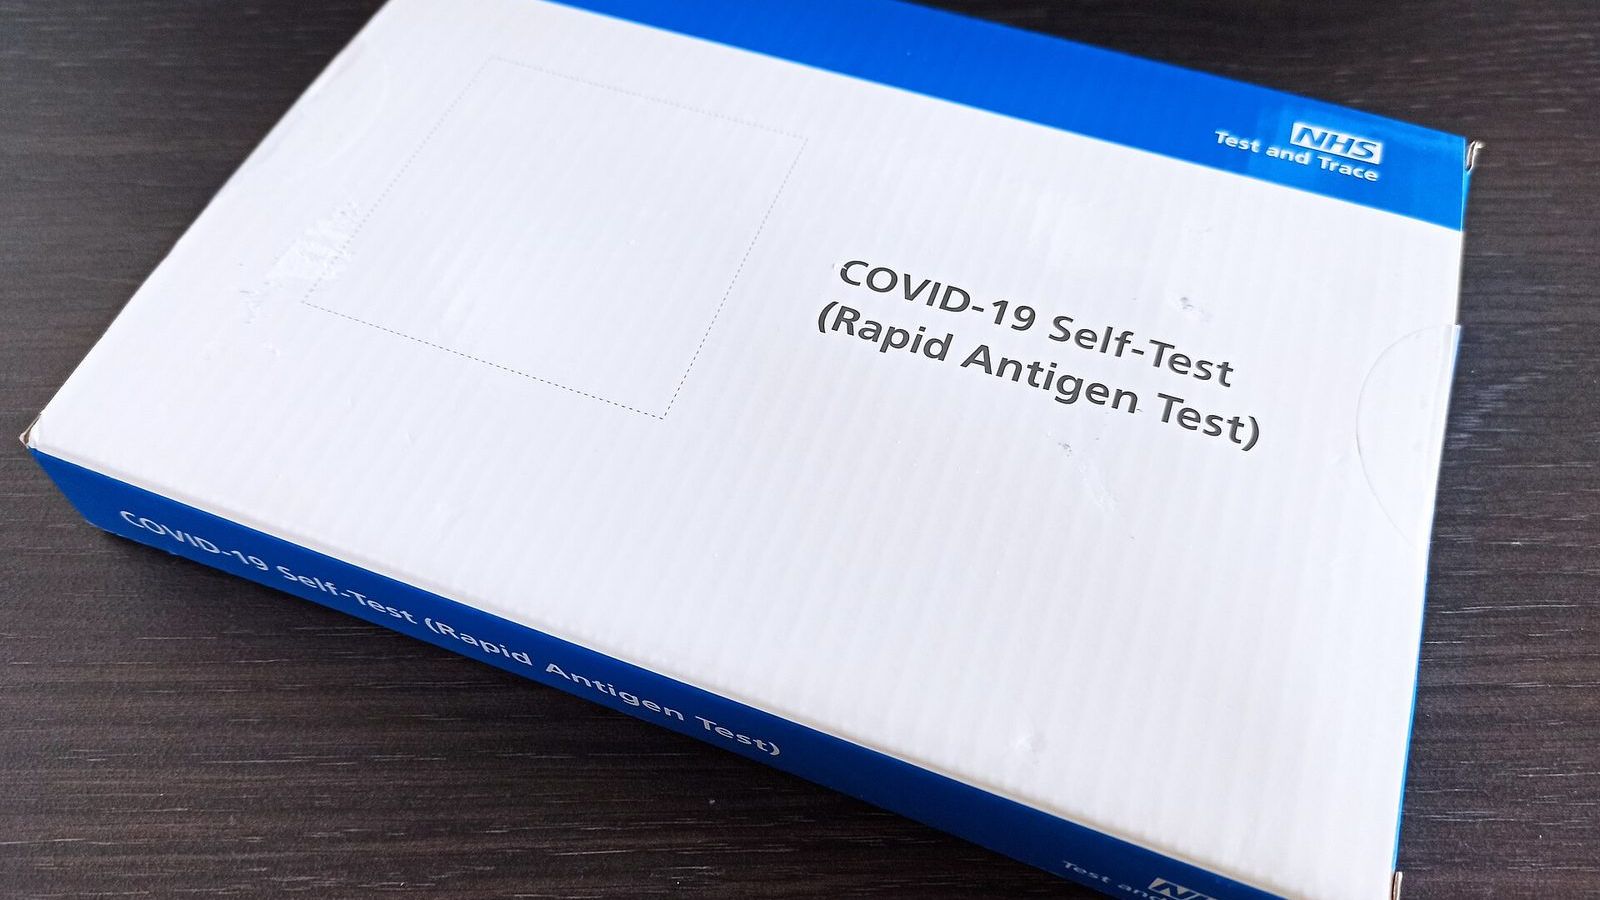
Now change the prevalence and keep the test. A rapid antigen test for a respiratory virus detects, say, 70 per cent of infections and gives a false positive in 0.5 per cent of uninfected people. Those are realistic figures for the tests sold in pharmacies during the covid-19 pandemic.
Use it on 1,000 people chosen at random from a population where 1 person in 200 is infected. Five are infected and the test finds about 3 or 4 of them. Of the 995 uninfected, about 5 test positive. Positives: roughly 4 true and 5 false, so a positive result is right less than half the time.
Use the same test on 1,000 people who have a fever and a cough during a wave, where 1 in 5 is infected. Now 200 are infected and the test finds 140; of the 800 uninfected, 4 test positive. Positives: 140 true and 4 false, and a positive result is right 97 per cent of the time.
Nothing about the test changed between the two groups. The same kit, with the same chemistry, is a weak signal in one population and a strong one in the other. That is why a positive test in someone with symptoms during an outbreak is believed and the same result in a random screening is repeated before anyone acts on it, and why a negative rapid test in a symptomatic person during a wave is not very reassuring: with 70 per cent sensitivity, 60 of the 200 infected people in the second group tested negative.
Why screening programmes are a hard decision
The arithmetic is the reason that mass screening of healthy people is argued about by people who all have the data. Screening a whole population for a rare disease produces, inevitably, many more false alarms than true findings, and every false alarm costs anxiety, further tests, and sometimes a biopsy or an operation for a condition that was never there. Against that stand the cases found early. Whether the balance favours screening depends on the prevalence, the accuracy of the test, how much early detection helps, and how harmful the follow-up is, and the answer differs between diseases and between age groups. The Harding Center for Risk Literacy in Potsdam publishes fact boxes that present these numbers for common screening tests as counts per 1,000 people, in the format this article has used.
The number that matters to a patient is the one this article has been computing, the probability of disease given a positive test, which doctors call the positive predictive value. It is not printed on the box, because it depends on who is being tested. The two numbers that are printed on the box, sensitivity and specificity, are properties of the test and tell you the predictive value only after you have supplied the prevalence yourself.
The general rule
Whenever a test, an alarm, a filter, or a detector is applied to a population in which the thing it looks for is rare, most of its alerts will be false, however good the detector. Airport security screens millions of innocent travellers for a handful of threats. A spam filter with a 1 per cent false-positive rate, applied to a mailbox in which spam is rare, puts more good mail in the junk folder than bad. A screening question for a rare condition in a general practice flags mostly people who do not have it. The arithmetic is identical in every case, and so is the remedy: ask what the base rate is before you ask how accurate the test is.
Unit 3 of the Statistics Masterclass introduces conditional probability with the array of 1,000 people and shows that Bayes' theorem is the same calculation in a formula. The free dataset of that week, Seeing Theory from Brown University, lets you drag the prevalence up and down and watch the positive predictive value follow, which is the quickest way there is to make the lesson permanent.