
The history of statistics
The people and the data behind the methods: Snow's two water companies, Nightingale's rose diagram, the brewer called Student, and Galton's bean machine. These articles go with the history excursions of the units.
Articles
How to enter a statistics competition as a student
A poster competition for school students, a project competition, a weekend of data analysis for undergraduates, and online prediction contests open to anyone. What each one asks for, who may enter, and which units of the program prepare for it.
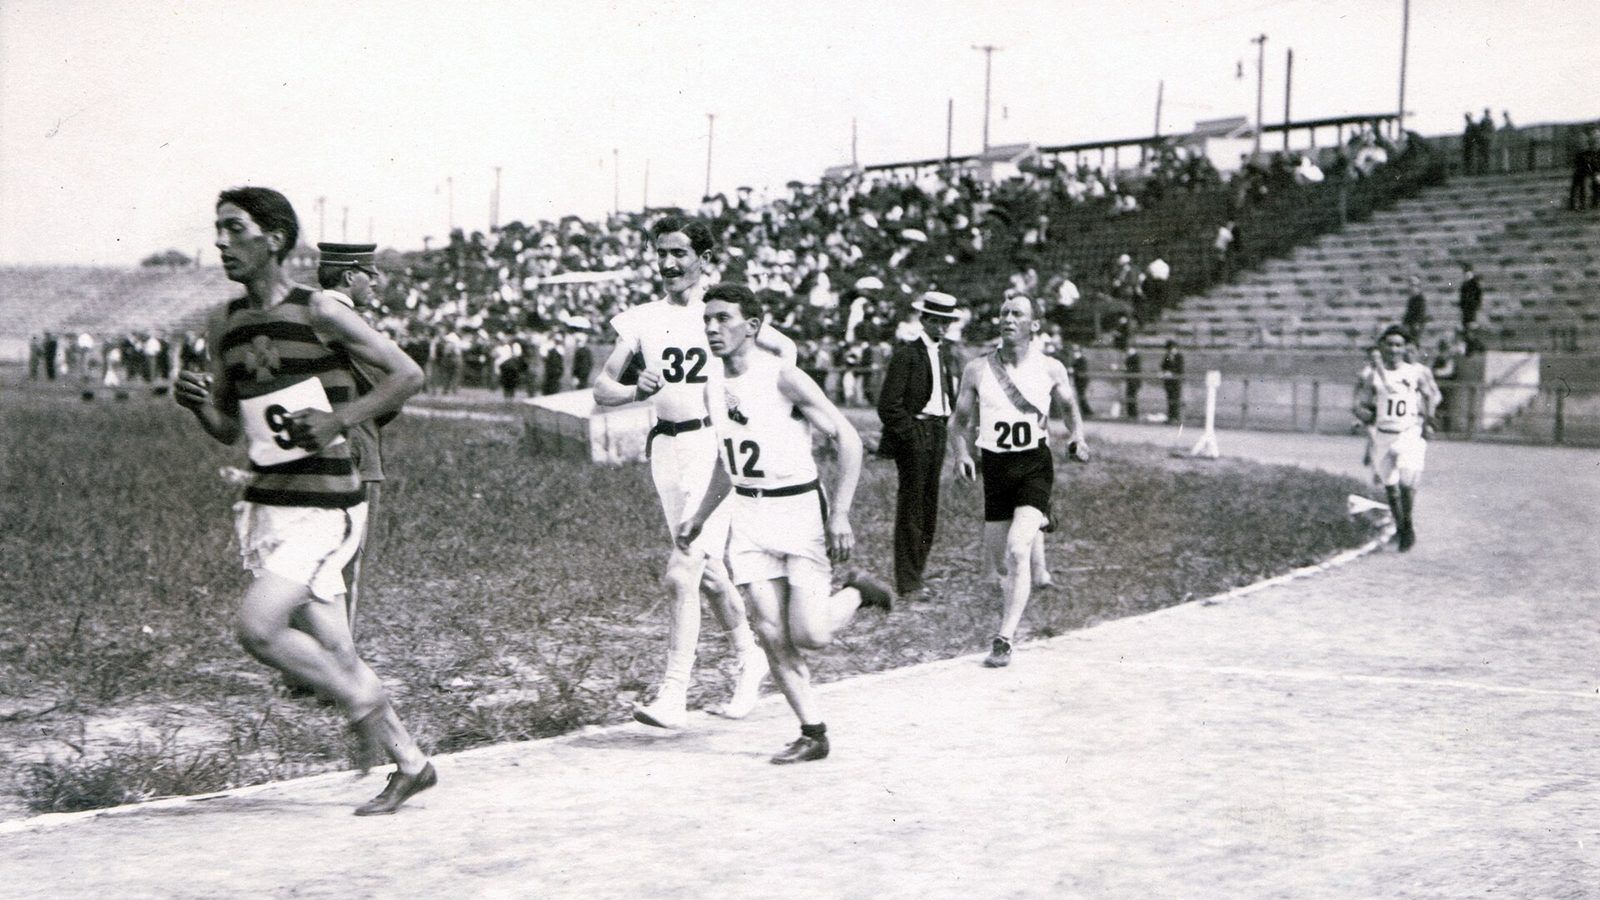
Regression to the mean, the most misread pattern in sport and school
The worst students improve on the retest and the athlete on the magazine cover has a poor season. No cause is needed: whenever a measurement contains chance, extreme values are followed by less extreme ones. Galton found it in 1886, and it is still misread every day.

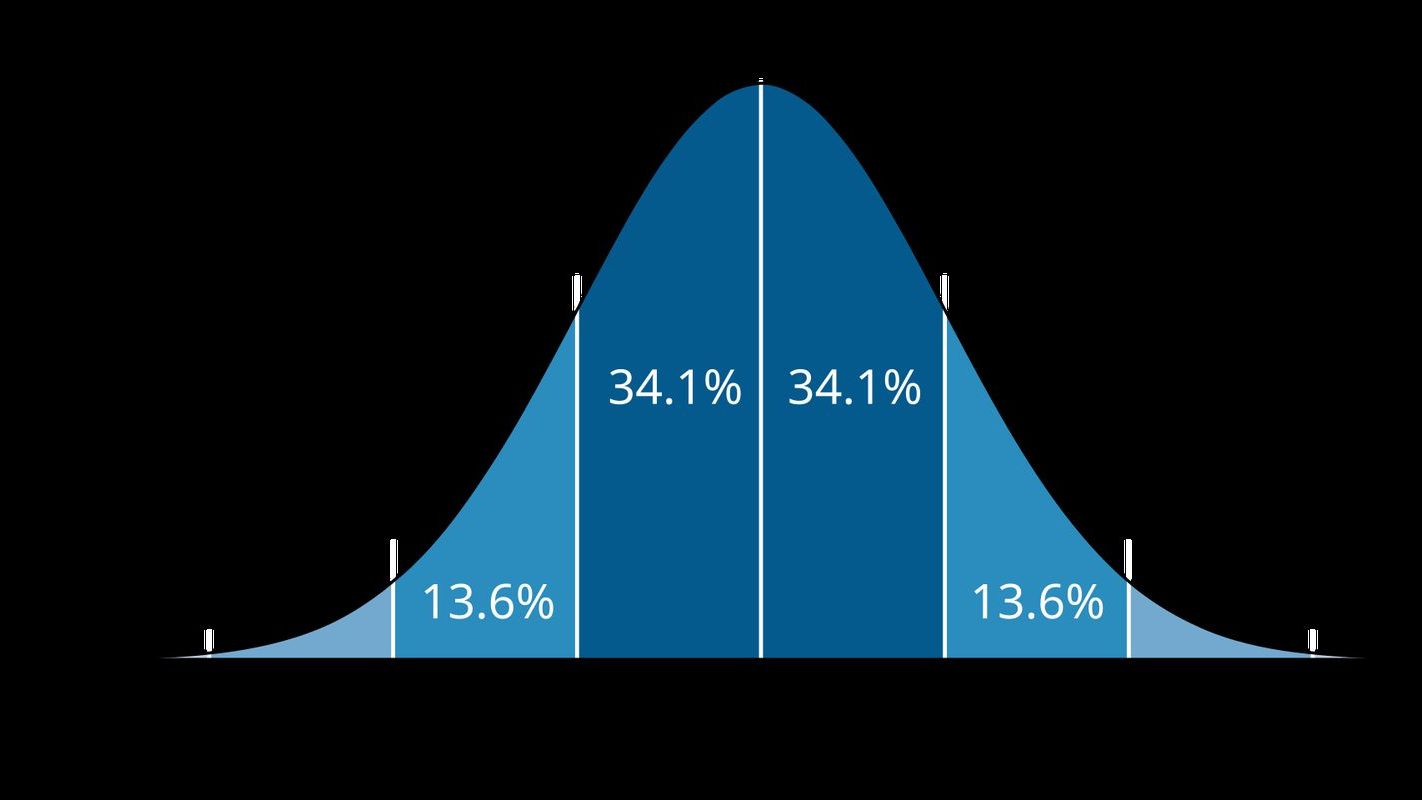
Why so many things are bell-shaped, and why some are not
Heights, measurement errors, and exam scores follow the bell curve. City sizes, earthquakes, and fortunes do not. The central limit theorem explains the first group, and a different kind of arithmetic explains the second.
Florence Nightingale's rose
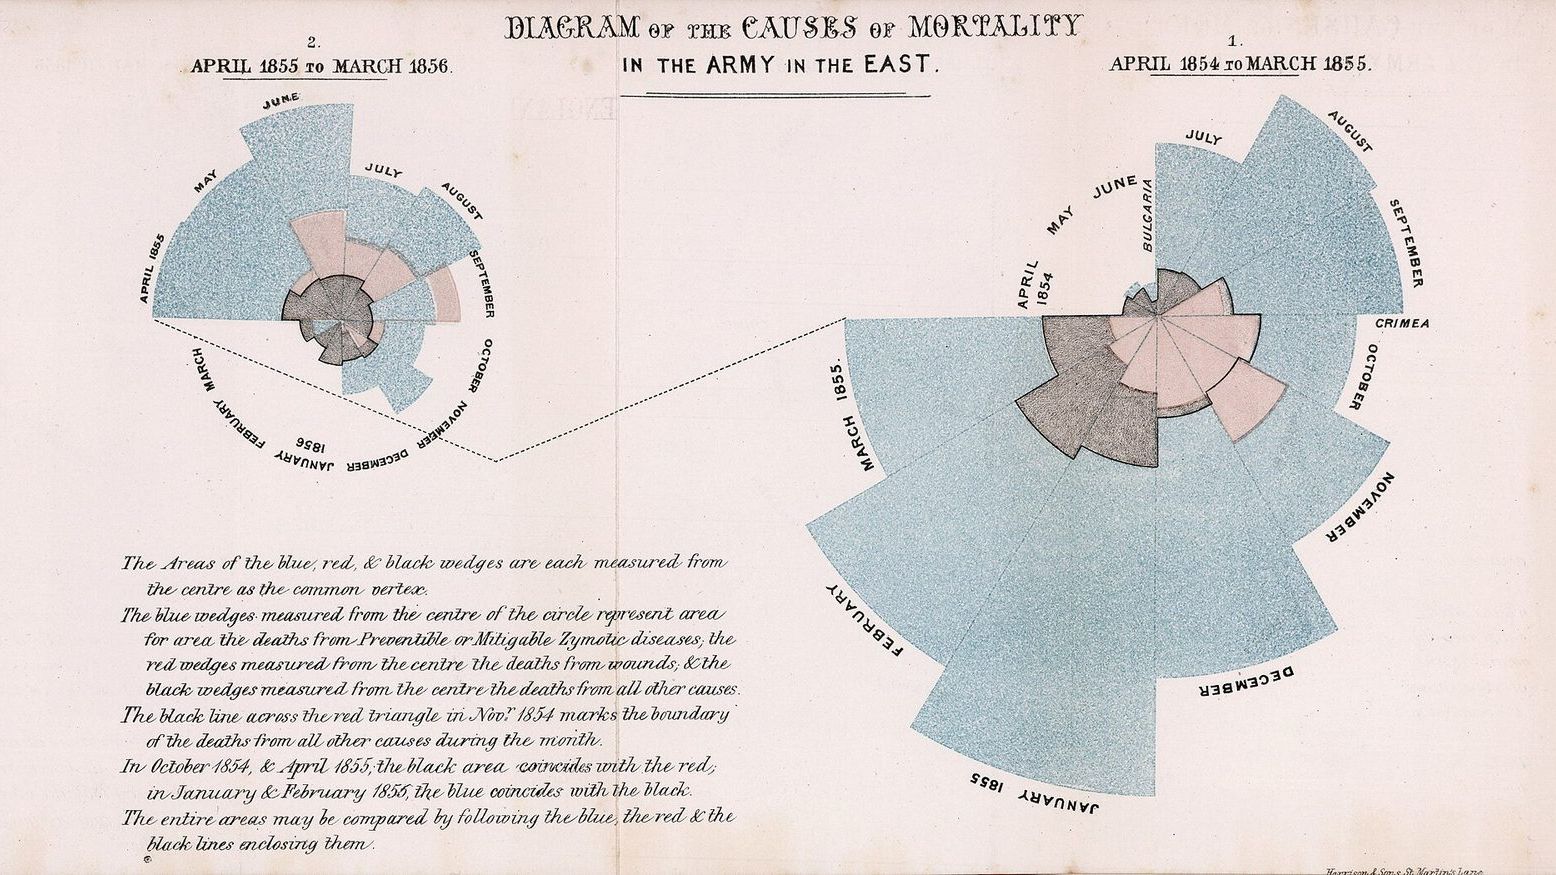
In 1858 Florence Nightingale drew a diagram showing that far more British soldiers in the Crimean War had died of disease than of wounds. How to read the rose diagram, where it misleads, what it achieved, and how she became the first woman in the Statistical Society.
The brewer who signed his papers "Student"
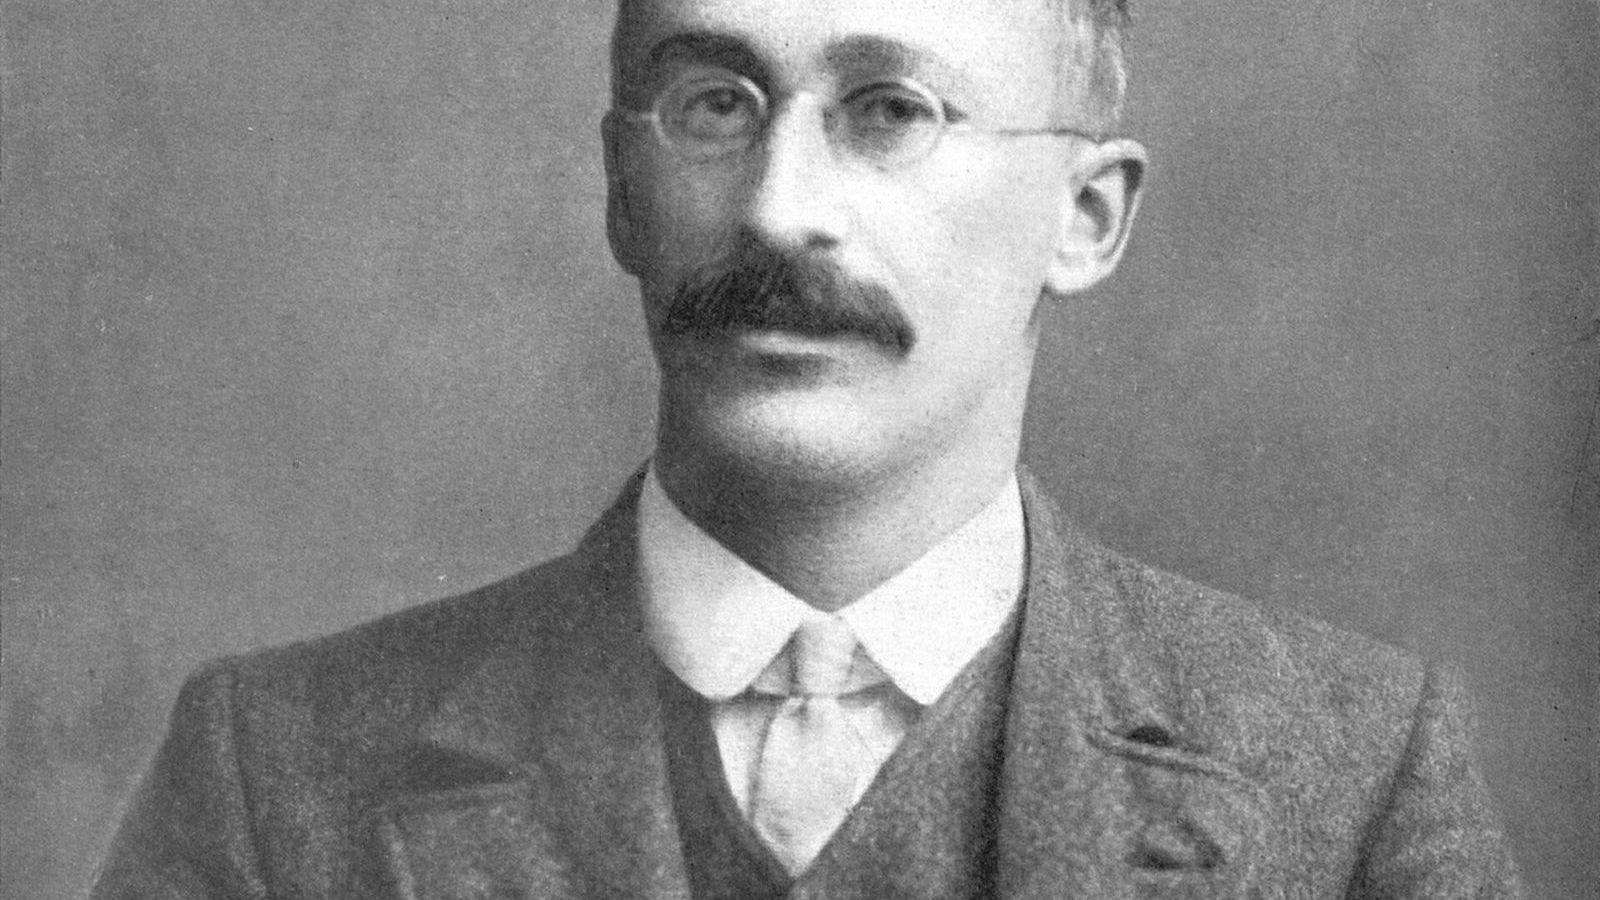
William Sealy Gosset worked for the Guinness brewery in Dublin and needed to draw conclusions from a handful of measurements. His 1908 paper, published under a pen name because his employer forbade publication, gave statistics the t distribution and the small sample its proper uncertainty.
What a p-value is, and what it is not
A p-value is the probability of data at least as extreme as yours, if the null hypothesis were true. It is not the probability that the hypothesis is true, and it is not the probability that your result is a fluke. The definition, the three common misreadings, and the six principles of the American Statistical Association.
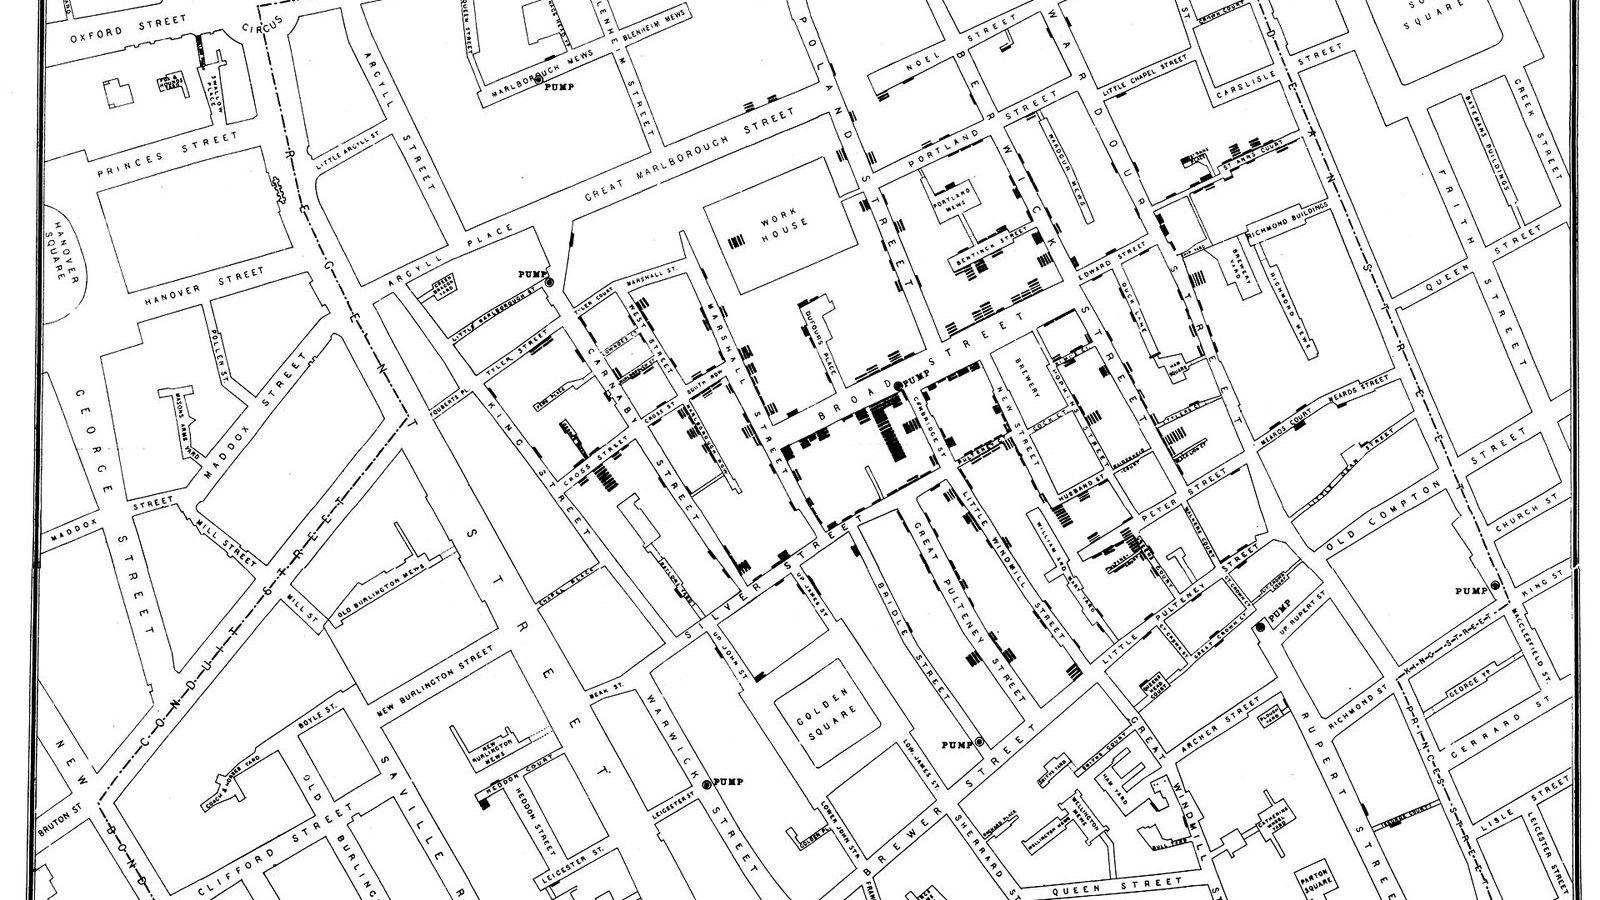
The Broad Street pump and the experiment nobody planned
In 1854 two water companies supplied the same London streets, one of them from the Thames below the city's sewage outlets. John Snow counted 315 cholera deaths per 10,000 houses for one company and 37 for the other, and the comparison became the first natural experiment.
In the masterclass
Data, Variables, and the Statistician's Toolkit
Data, variables, sums, percentages, logarithms, and the first graphs that every later unit uses
Describing Distributions
Histograms, box plots, centre, spread, and standardized values
Estimation and Confidence Intervals
Point estimates, standard errors, Student's t, and confidence intervals for means and proportions
Sampling and the Central Limit Theorem
Random samples, sampling distributions, the standard error, and why means pile up in a bell curve