
Statistics Masterclass Blog
Explanations, background, and advice for curious students.
Latest articles
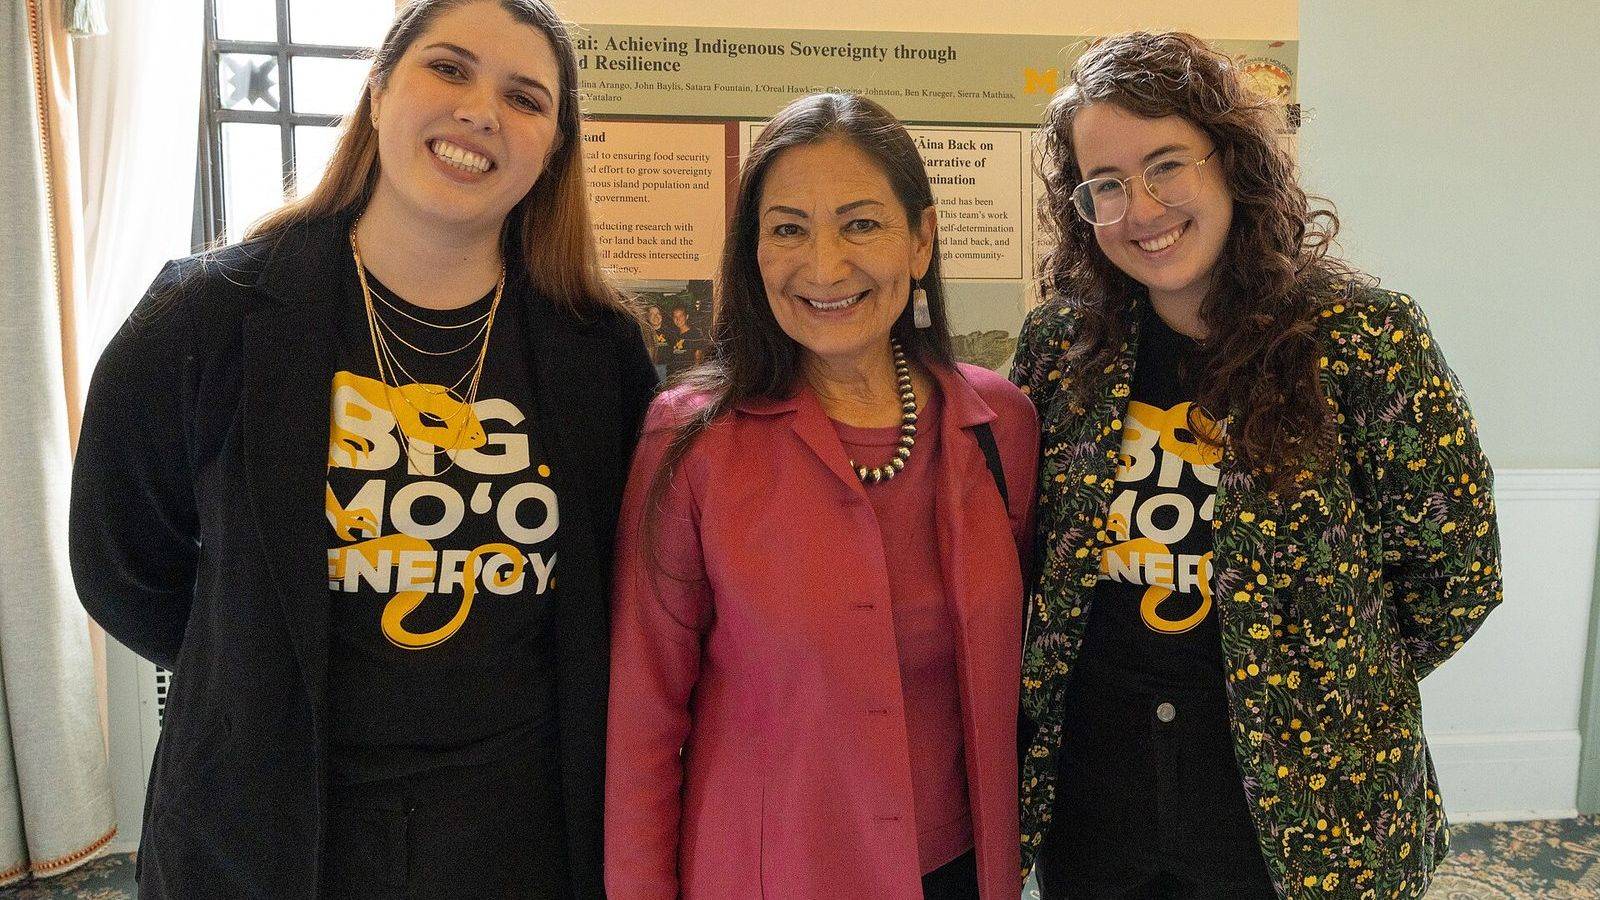
How to enter a statistics competition as a student
A poster competition for school students, a project competition, a weekend of data analysis for undergraduates, and online prediction contests open to anyone. What each one asks for, who may enter, and which units of the program prepare for it.

Why 36 of 100 psychology findings did not replicate
In 2015 the Open Science Collaboration repeated 100 published psychology experiments. Thirty-six of the replications were significant. Nobody found fraud; the causes were the garden of forking paths, publication bias, and small samples, and the remedies are now changing how science is done.

How a random forest makes a decision
A decision tree asks one question at a time and is easy to read and easy to fool. Grow hundreds of trees on resampled data, let each see only a random subset of the variables, and take a vote: that is a random forest, and the reason it works is the arithmetic of averaging.

What the lasso does to a regression
Add a penalty on the sum of the absolute coefficients to least squares and something unexpected happens: coefficients shrink, and then, one by one, become exactly zero. Robert Tibshirani's method of 1996, the diamond and the circle, and why genomics needed it.
The bootstrap in one page
Draw your own sample again and again, with replacement, and compute the statistic each time. The spread of the results is the standard error you could not derive. Bradley Efron's method of 1979 explained, with the reason 37 per cent of the data sit out of every resample.
A coin is not quite fair, and we know why
In 2007 Persi Diaconis and two colleagues predicted from the physics of a spinning coin that it lands the way it started about 51 per cent of the time. In 2023, 48 people flipped coins 350,757 times and got 50.8. What that means for a coin toss, and for what a probability is.

Correlation is not causation, and what is
Countries with more storks have more babies, and a treatment that is better for small stones and better for large stones is worse overall. Confounders and Simpson's paradox explain how, and three kinds of study design explain how a cause can be found at all.
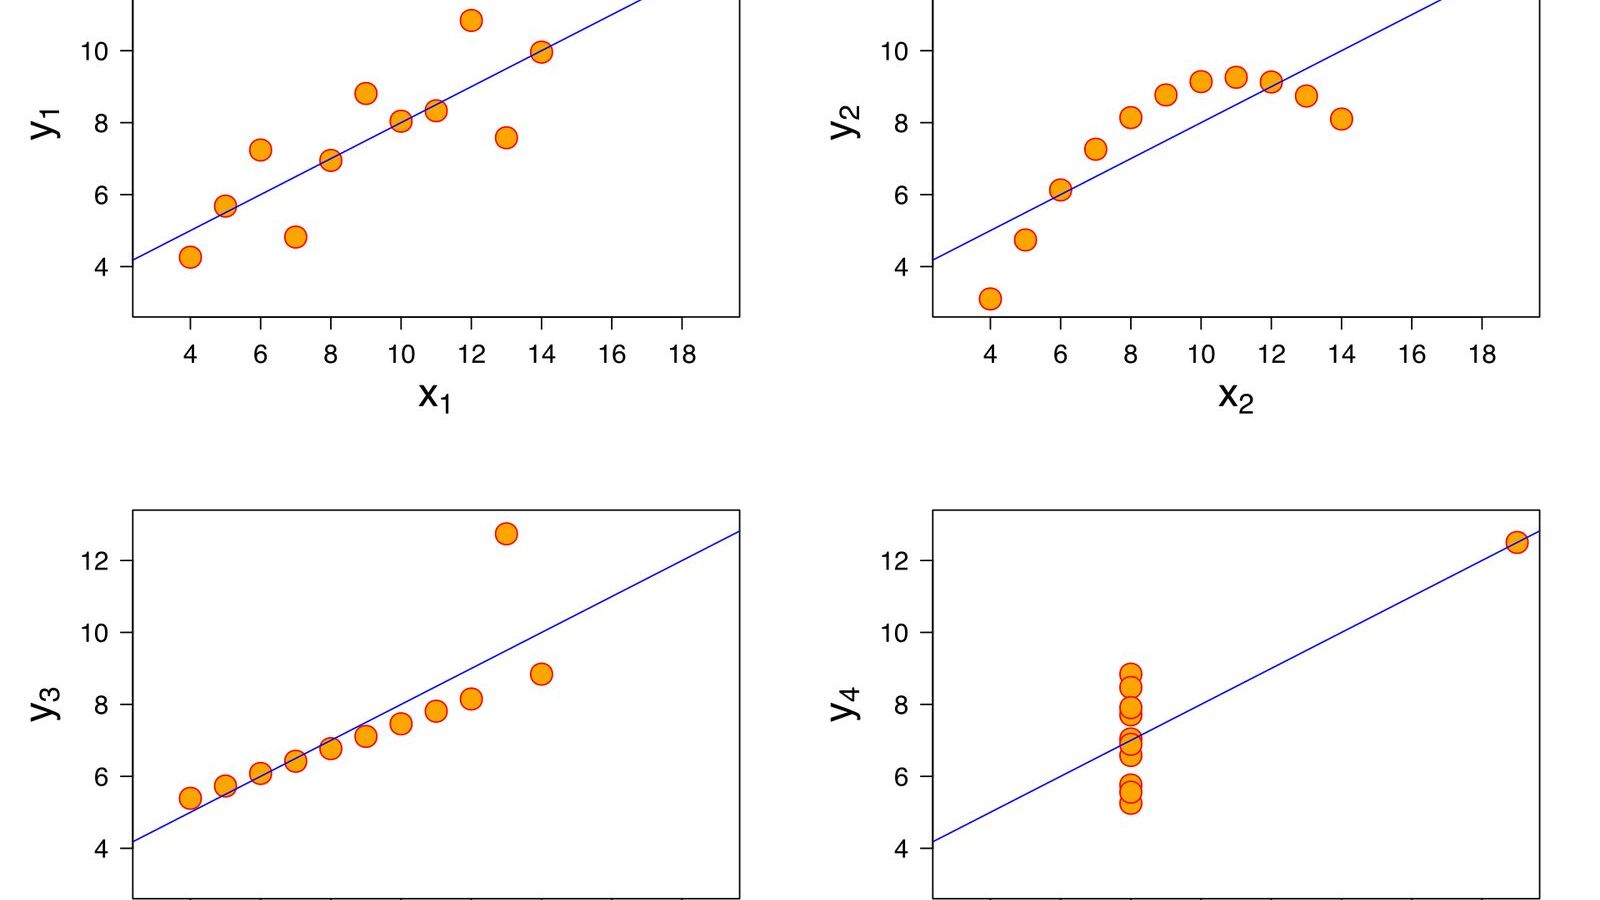
Same statistics, different pictures
Frank Anscombe built four datasets in 1973 with the same means, variances, correlation, and regression line, and plots that look nothing alike. In 2017 a dinosaur made the same point. Why the plot comes before the calculation.
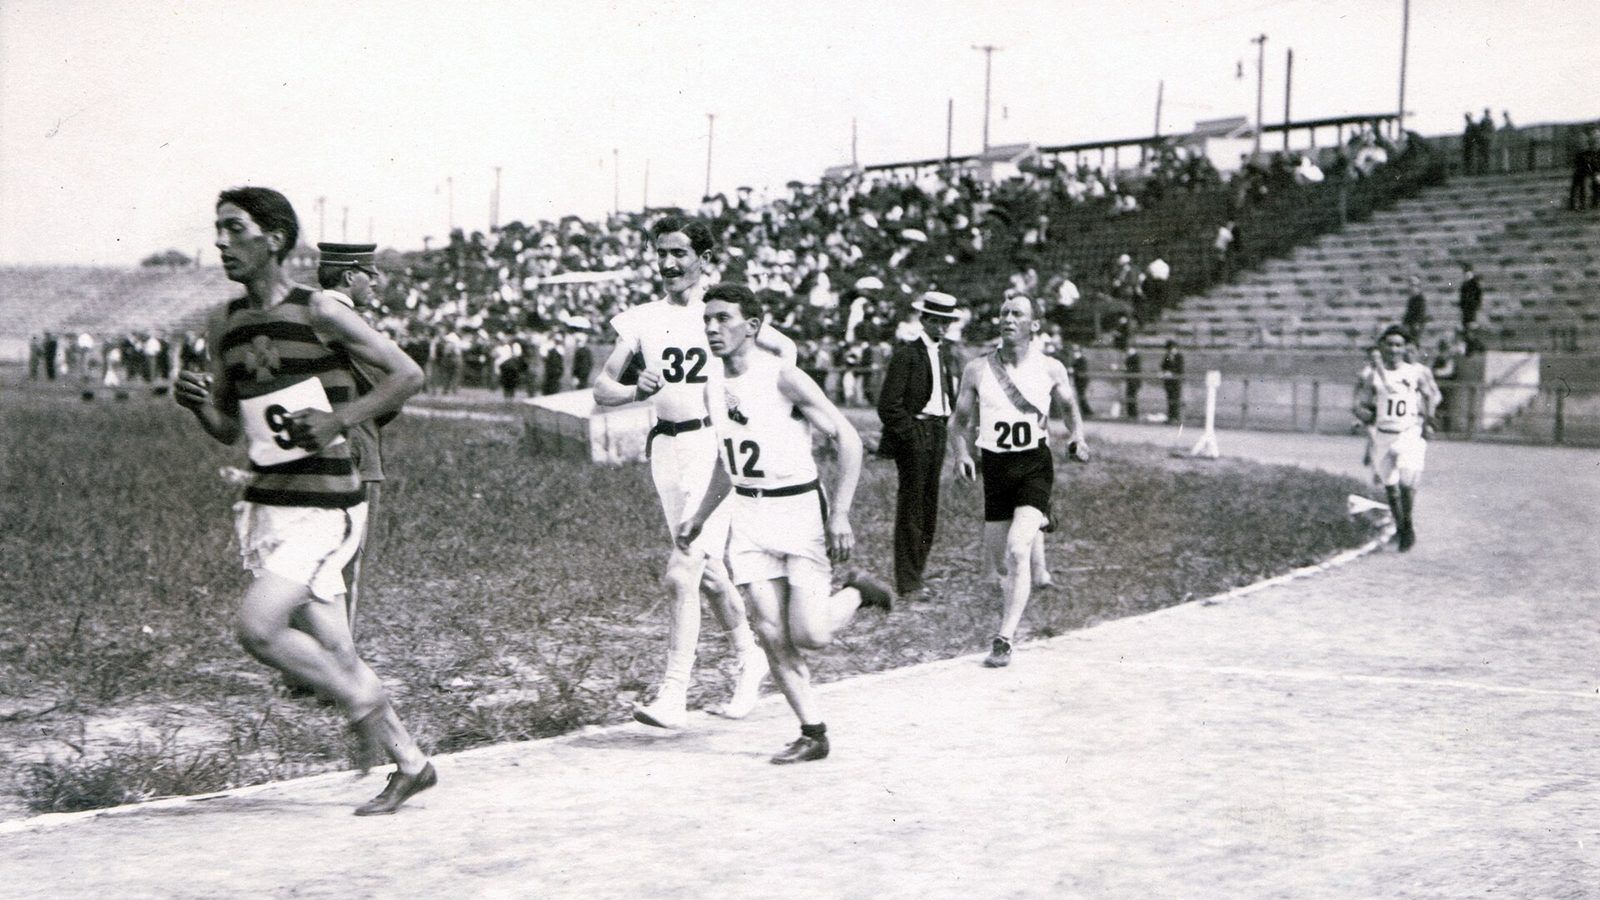
Regression to the mean, the most misread pattern in sport and school
The worst students improve on the retest and the athlete on the magazine cover has a poor season. No cause is needed: whenever a measurement contains chance, extreme values are followed by less extreme ones. Galton found it in 1886, and it is still misread every day.