 Image: John Snow, 1855, public domain
The Broad Street pump and the experiment nobody planned
Between 31 August and 10 September 1854, more than 500 people died of cholera within a few hundred metres of a water pump on Broad Street in Soho, London. By the time the outbreak had run its course the count was 616. The physician John Snow, who lived nearby, spent those days walking from house to house with the registrar's list of deaths, asking one question: where did the dead get their water?
A map, and what a map cannot prove
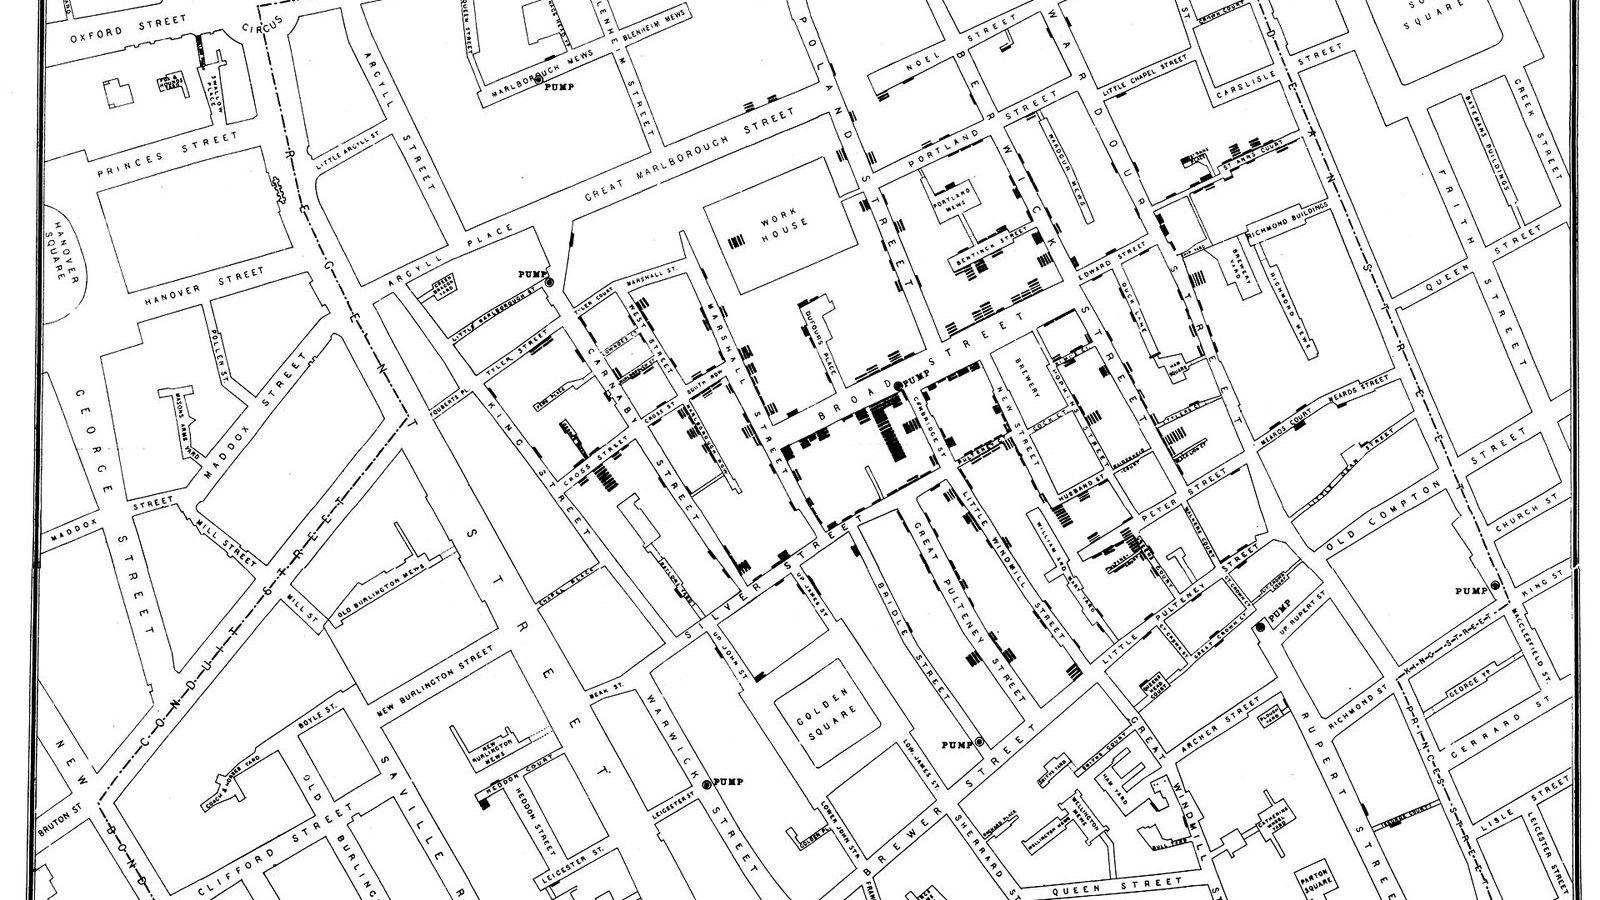
The map Snow published the next year is the one everybody knows. Every death is a short black bar stacked at the house where it happened, and the bars pile up around the pump. He had counted 83 deaths in the first three days, and 73 of the dead had lived closer to the Broad Street pump than to any other. Of the ten exceptions, five had preferred the Broad Street water for its taste and three were children who went to school near it. The workhouse on Poland Street, with 535 inmates and its own well, lost only five. The brewery on Broad Street, where the men drank the beer, lost nobody.
On 7 September Snow put this to the parish Board of Guardians. The next day the handle of the pump was taken off. The outbreak was already fading by then, because most of the people who could leave Soho had left, so the removal of the handle proved less than the story usually implies. Snow said so himself.
The map also has a logical gap that a careful reader in 1854 would have pointed out at once. The people who drank from the pump also breathed the air around it, and the medical establishment of the day believed that cholera came from bad air, the miasma that rose from filth. A cluster on a map cannot tell the two apart. Anything that varies with distance from the pump, air included, explains the same picture. Snow needed a comparison in which water differed and everything else did not.
Two companies, the same streets
He had it, south of the river. Two private companies supplied water to the districts of Lambeth, Southwark, and the streets around them. The Southwark and Vauxhall Company took its water from the Thames at Battersea, inside the city and below the outfalls of the sewers. The Lambeth Company had done the same until 1852, when it moved its intake upstream to Thames Ditton, above the sewage. In the epidemic of 1849, before the move, both companies' customers had died at about the same rate.
What made the comparison worth more than any map was the way the pipes were laid. The two companies had competed house by house in the 1830s and 1840s, and their mains ran down the same streets. Neighbours were supplied by different companies. Often a house on one side of a court had one supply and the house opposite the other. The landlord had signed the contract years earlier, and most tenants did not know which company served them. Rich and poor, clean and dirty, upstairs and downstairs, were mixed across both.
Snow wrote that no experiment could have been devised that would test the effect of the water more thoroughly, and that it was ready-made, on the grandest scale, with more than 300,000 people of both sexes, every age, every occupation, and every rank, divided into two groups without their choice and mostly without their knowledge. That is the sentence in which the natural experiment was born, although the name came much later.
The counting
The hard part was finding out which company supplied each house where someone had died. Snow got the addresses of the deaths from William Farr at the General Register Office and then went to the houses. Many residents did not know their supplier. He solved that with chemistry: Lambeth water had almost no salt, and a drop of silver nitrate in a sample from the tap told him within a minute which river intake it had come from.
For the first seven weeks of the epidemic, up to 26 August 1854, the figures were these.
| Supply | Houses | Cholera deaths | Deaths per 10,000 houses |
|---|---|---|---|
| Southwark and Vauxhall Company | 40,046 | 1,263 | 315 |
| Lambeth Company | 26,107 | 98 | 37 |
| Rest of London | 256,423 | 1,422 | 59 |
The households with the downstream water died at eight and a half times the rate of their neighbours with the upstream water. The rest of London, with its mixture of supplies, sat in between. The numbers are rates, deaths per 10,000 houses, because the two companies served different numbers of homes and a raw count of deaths would have told you nothing. Snow published them in the second edition of On the Mode of Communication of Cholera in 1855, with the house-to-house inquiry described in enough detail that anyone could check it.
Why this is an experiment and the map is not
A comparison establishes a cause when the two groups differ in the suspected cause and in nothing else that matters. In a designed experiment, the investigator makes that true by assigning people to the groups at random, which is what Ronald Fisher formalized in the 1920s and what every clinical trial does today. Snow assigned nobody. The pipes had been laid by commercial accident decades earlier, and that accident did the work that a random draw does: it made the two groups alike in wealth, age, housing, and habits, and different only in their water.
An economist today would call the laying of the pipes a natural experiment and the company an instrument. The methods behind the Nobel Memorial Prize in Economic Sciences 2021, awarded to Joshua Angrist, Guido Imbens, and David Card, are the modern descendants of this reasoning, and Angrist's use of the Vietnam draft lottery to estimate the effect of military service on earnings has exactly the structure of Snow's two companies. The lottery, like the pipes, assigned people to groups without regard to anything about them.
The map, by contrast, is an observation. It shows that deaths and the pump went together. The two-company table shows that when water changed and nothing else did, deaths changed with it. Unit 8 of the Statistics Masterclass sets the two side by side as its first lesson on causation, and the distinction between them runs through everything that follows.
What the data did not do
Snow's evidence did not persuade the authorities. The Board of Health's own inquiry into the 1854 epidemic concluded that the cause was atmospheric. The Italian anatomist Filippo Pacini saw the cholera bacterium under his microscope in Florence in the same year, 1854, and nobody paid attention to him either; Robert Koch identified it again in 1883 and got the credit. Snow died of a stroke in 1858, aged 45, with his theory still a minority view. London built its sewers in the 1860s for the smell rather than for the water, and cholera left anyway.
The Reverend Henry Whitehead, a curate in Soho who had set out to disprove Snow, found the missing piece of the Broad Street story in 1855: a baby at 40 Broad Street had fallen ill with cholera two days before the outbreak began, and its mother had emptied the washing water into a cesspit less than a metre from the well of the pump. The cesspit's brickwork had decayed and leaked into the well.
A later generation of epidemiologists made Snow their founder, and the pump on Broadwick Street, as it is now called, has a replica and a plaque. The John Snow Archive and Research Companion at Michigan State University keeps his writings, maps, and the data tables online, where you can read the house-to-house inquiry in his own words.
What to take from it
Three habits of Snow's are still the habits of a good analysis. He compared rates, never raw counts, and he stated the denominator every time. He asked, before trusting a pattern, what else could produce the same pattern, and he went looking for the comparison in which that something else was held fixed. And he published the numbers, the method, and the exceptions, including the five deaths near the Broad Street pump that he could not explain.
In the Statistics Masterclass, the rates and the honest table are the business of Unit 1, and the two companies return in Unit 8, where the question of what a comparison can prove is the whole subject. If you want to see how the same question looks when the groups are not alike, the article on correlation and causation takes it further.