The Broad Street pump and the experiment nobody planned
The Broad Street pump and the experiment nobody planned is one of the clearest stories in the history of public health. In 1854, John Snow used a cholera map of London to show that deaths clustered around the Broad Street area in Soho, and he compared two water companies that supplied the same streets. That comparison, with 315 deaths per 10,000 houses for one company and 37 deaths per 10,000 houses for the other, is why many historians of statistics describe the episode as the first natural experiment.
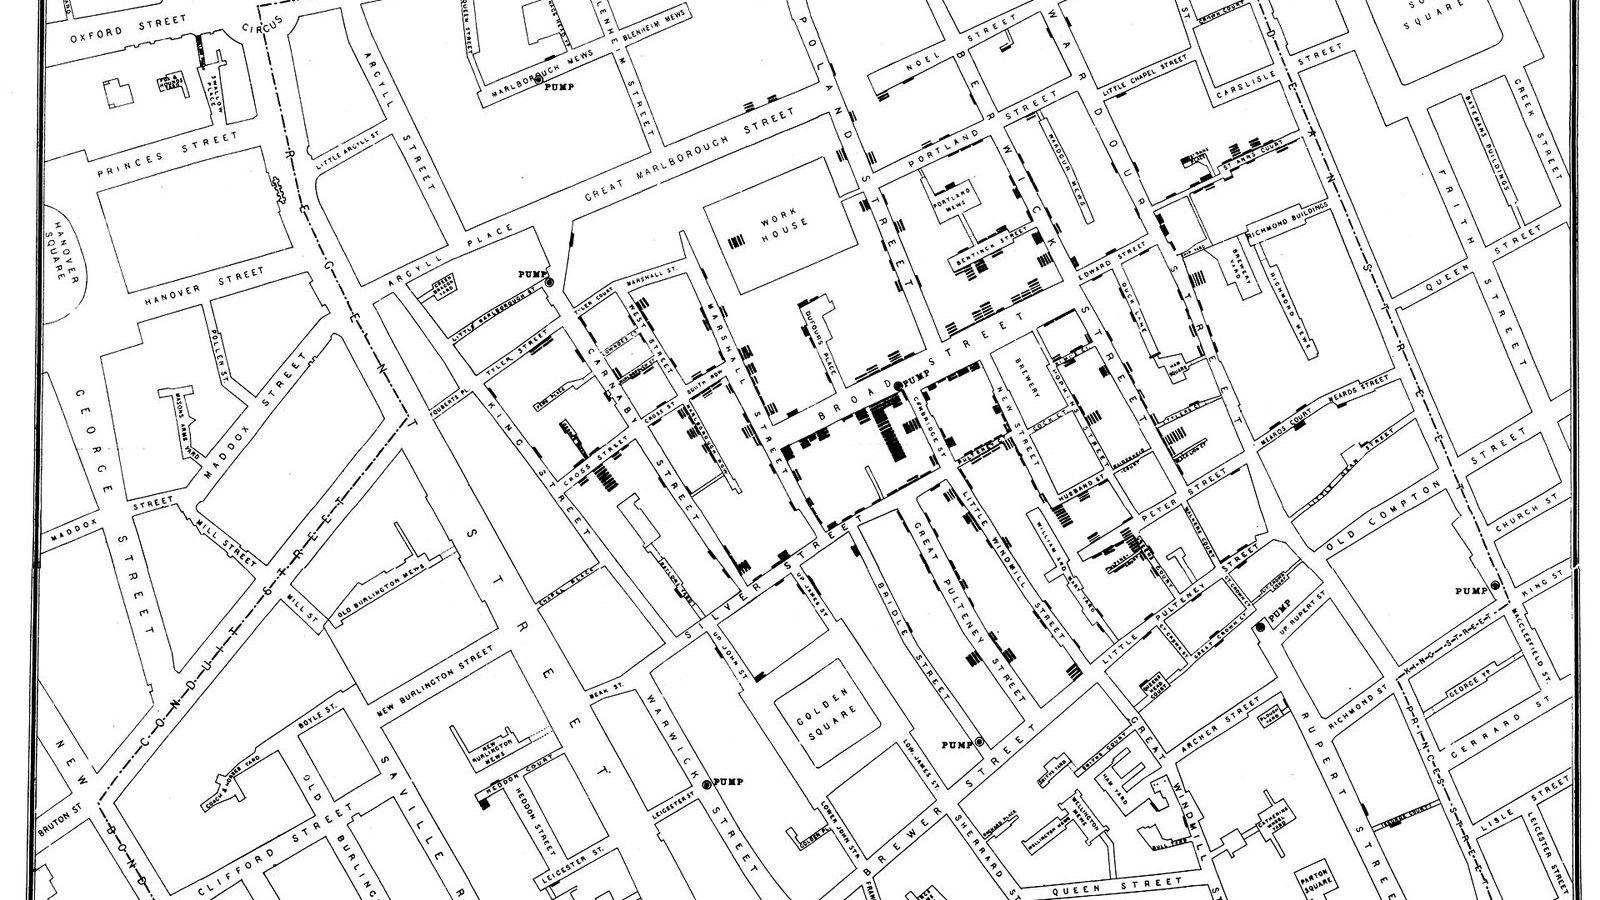
John Snow’s cholera map of 1854
Snow’s map was simple and powerful. Each dot stood for a cholera death, and the dots crowded around the Broad Street pump. The pattern did not prove the pump was guilty on its own, but it gave Snow a clear hypothesis: people were getting cholera from contaminated water, not from bad air.
Maps matter in statistics because they turn a list of deaths into a pattern that the eye can inspect. Snow did that at a time when germ theory was not yet established, which makes the map even more striking. A visual display can reveal structure before a formal model is available, as in Same statistics, different pictures and Florence Nightingale's rose.
The Broad Street pump and the experiment nobody planned
The key comparison was not just between people who lived near the pump and people who lived farther away. Snow also examined households served by two water companies, the Southwark and Vauxhall Company and the Lambeth Company. They supplied many of the same streets in south London, so the social mix of their customers was similar. The main difference was the source of water.
That matters because it creates something close to an accidental trial. The choice of water company was not assigned by Snow, and households were not selected because they wanted one exposure or the other. Yet the exposure differed in a way that helped isolate cause and effect. This is why the case is often called a natural experiment: nature, or circumstance, created the comparison for the investigator.
| Water company | Reported cholera deaths per 10,000 houses |
|---|---|
| Southwark and Vauxhall | 315 |
| Lambeth | 37 |
The gap is large enough to make the point without fancy modelling. If one group has more than eight times as many deaths per 10,000 houses as another, and the streets are similar, the water supply deserves serious attention. Snow’s analysis did exactly that.
Why the comparison counts as a natural experiment
In a planned experiment, the researcher assigns treatment. In Snow’s case, the world did the assigning earlier, through the placement of pipes and company boundaries. That is why the comparison sits at the centre of causal thinking in statistics. The exposure changed, the population was broadly similar, and the outcome changed with it.
Still, a natural experiment is never perfect. Households may differ in small ways, and historical data can be incomplete. The point is that the design reduces alternative explanations enough to make the causal argument much stronger than a simple before and after comparison. This logic sits close to the ideas in Correlation is not causation, and what is and the correlation, regression, and causation topic page.
Snow’s work also helps students see the difference between association and explanation. A map can show association. A structured comparison can suggest explanation. The move from one to the other is where statistics becomes more than counting.
What students should notice in Snow’s method
There are three practical lessons here. First, good data display can reveal a pattern fast. Second, a fair comparison often comes from groups that were not formed by the investigator. Third, a causal claim is strongest when a plausible mechanism matches the data. For Snow, the mechanism was contaminated water, and later bacteriology supported that view.
This is also a reminder that statistics is not only about formulas. It is about asking how data were produced, what groups were compared, and what other explanations remain. Those ideas begin in Unit 1 of the masterclass, Data, Variables, and the Statistician's Toolkit and deepen in Unit 8 of the masterclass, Correlation, Regression, and Causation.
For historical context, see the CDC cholera overview and the WHO cholera fact sheet. For broader discussion of causality and natural experiments in health research, the BMJ publishes many relevant articles, including historical work on Snow and cholera.
Frequently asked questions
Why is Snow’s work called a natural experiment?
Because the two water companies supplied similar streets, but the water source differed in a way Snow did not assign himself. That gave him a near experimental comparison without randomisation.
Did Snow prove that the pump caused cholera on its own?
No single table proved everything. The map, the household comparisons, and the water-company data all pointed in the same direction, which made the case much stronger.
Why do students still study this case?
It shows how to think about causation from real-world data. The Broad Street case links visualisation, comparison groups, and causal reasoning in a form that is easy to remember.