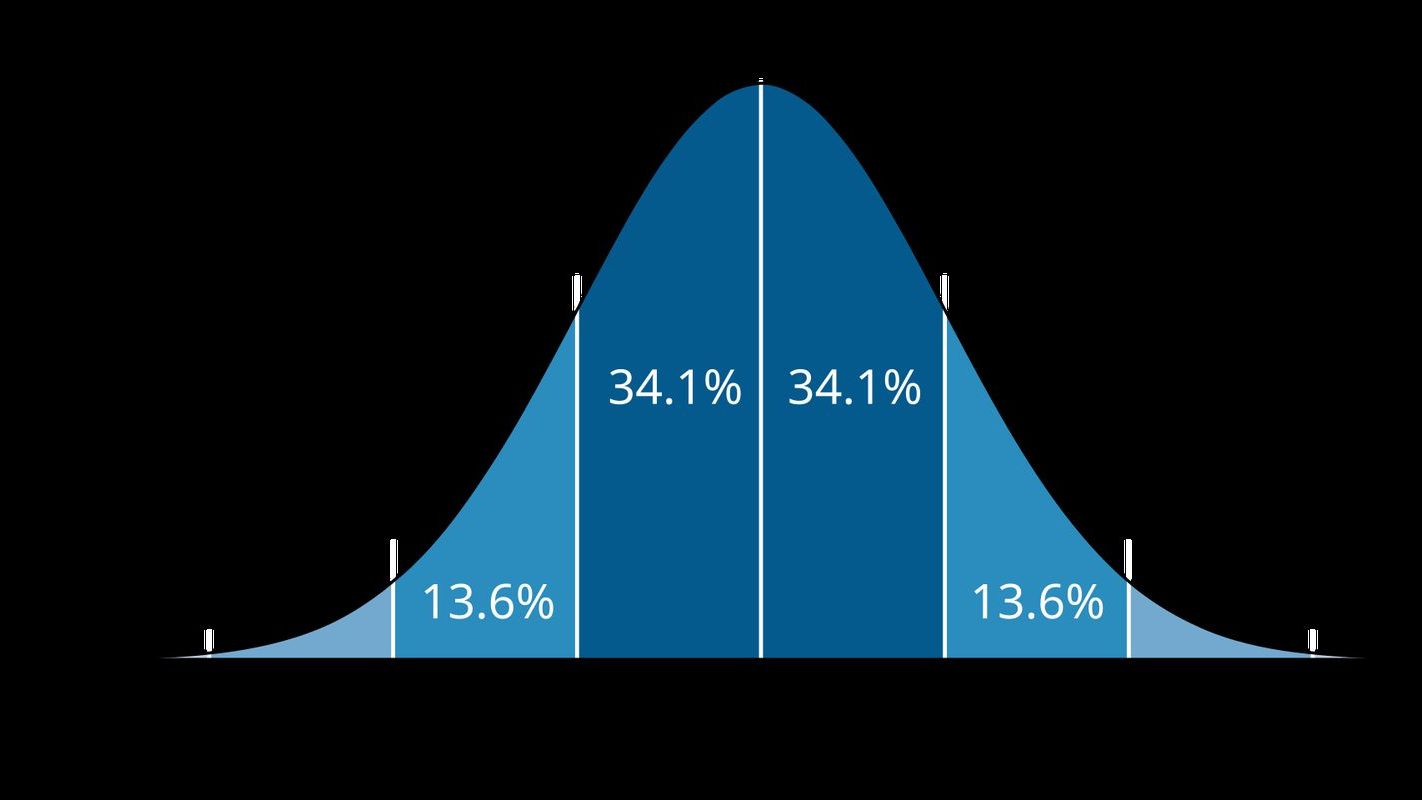
 Image: SKopp, CC BY 4.0
Why 36 of 100 psychology findings did not replicate
Between 2011 and 2015, 270 researchers coordinated by Brian Nosek at the Center for Open Science repeated 100 experiments published in three leading psychology journals in 2008. They used the original materials where they could get them, asked the original authors to check the protocols, and used larger samples than the originals. Of the 100 original studies, 97 had reported a statistically significant result. Of the 100 replications, 36 did. The replicated effects were on average about half the size of the originals, and every dataset and protocol is public on the Open Science Framework.
The result was reported as a crisis, and in the decade since, similar projects in economics, cancer biology, and the social sciences have found replication rates between 40 and 70 per cent. The interesting question is why, and the answer is almost entirely statistical.
What a failed replication means
First, what it does not mean. A replication that does not reach significance is not proof that the original was false. If the true effect is small, both an original study and its replication can be expected to miss significance some of the time, and a replication with a confidence interval that includes the original estimate is not a contradiction. The project reported that 47 per cent of the original effect sizes fell inside the replication's 95 per cent interval. Nor did anyone find fraud; the authors of the originals had done what the field expected of them.
What the result does show is that a p-value below 0.05 in a published paper was a much weaker guarantee than its readers assumed, and the reasons were already in the literature before the project ran.
The garden of forking paths
In 2011 Joseph Simmons, Leif Nelson, and Uri Simonsohn published a paper with an experiment that proved, at the 5 per cent level, that listening to a Beatles song made people younger. They had done it by exploiting what they called researcher degrees of freedom: choosing after the fact which of two outcome measures to report, whether to include a covariate, when to stop collecting data, and which of three conditions to compare. Each choice was defensible. With four such choices available and made in whichever direction gave the better p-value, they showed by simulation that the chance of a false positive rises from 5 per cent to above 60 per cent.
Andrew Gelman and Eric Loken named the general case the garden of forking paths in 2013, and their essay makes a point that is easy to miss: the researcher need not try several analyses and pick the best. It is enough that the analysis was chosen after seeing the data. A researcher who would have analysed different data differently has, in effect, run many tests, even though only one was computed, and the p-value from that one test no longer means what it claims. The article on what a p-value is states the principle this violates: the calculation assumes the test was fixed before the data were seen.
Publication bias and the file drawer
Journals publish positive results. A study that finds an effect is written up; one that finds nothing goes in the file drawer, a phrase Robert Rosenthal coined in 1979. If twenty laboratories test a false hypothesis, one of them will get a p-value below 0.05 by chance, that one will be published, and the literature will contain a significant finding with no indication of the nineteen failures behind it. Multiple testing across a whole field works exactly like multiple testing within one study, and the field has no Bonferroni correction. The 97 per cent rate of significant results among the original studies is itself evidence of the filter: no field has that success rate in the laboratory.
Small samples
The third cause is low statistical power. Many of the original studies had a few dozen participants, and a study of 40 people has, for an effect of typical size in psychology, perhaps a one in three chance of detecting it. Low power has a consequence that surprises people: among the significant results such a study does produce, a large share are false positives or overestimates, because a small study can only reach significance when the observed effect is large, whether or not the true effect is. The replications, with larger samples, measured the effects more accurately and found them smaller. In 2013 Katherine Button and colleagues estimated the median power of neuroscience studies at about 21 per cent.
John Ioannidis had put these three causes together in 2005 in an essay titled Why Most Published Research Findings Are False, and the arithmetic of that essay, combining prior plausibility, power, and bias in a single table, is the research spotlight of Unit 7 of the Statistics Masterclass. Its conclusion is not as bleak as its title; it is that the proportion of true findings depends on quantities that can be measured and improved.
What has changed
The most direct remedy is to fix the analysis before the data arrive, which is what preregistration does: the hypotheses, the sample size, the outcome measure, and the statistical test are deposited with a time stamp before the study begins, and the garden has one path. The Center for Open Science hosts tens of thousands of such registrations. Registered reports go a step further: the journal reviews and accepts the design before the results exist, so that a null result is published and the file drawer empties. More than 300 journals now offer the format, and the share of null results among registered reports is many times that of the ordinary literature.
The other remedies are the ones statisticians had asked for all along: larger samples, with power calculated in advance; effect sizes and confidence intervals reported alongside p-values; data and code made public; and direct replication valued as science rather than as housekeeping. A 2016 Nature survey of 1,500 scientists found that more than 70 per cent had failed to reproduce another scientist's experiment, and about half had failed to reproduce their own, which suggests the problem was never confined to psychology. Psychology's distinction is to have measured it first and to have changed its practices fastest.
Unit 7 of the Statistics Masterclass uses the Reproducibility Project as its dataset of the week, and Unit 16 treats the mathematics of many tests, from the Bonferroni correction to the false discovery rate, which is the formal version of what went wrong.