

Multiple Testing and the False Discovery Rate
The closing unit asks what the 5 per cent level of Unit 7 turns into when a study runs twenty, ten thousand, or eight million tests. The family-wise error rate and the Bonferroni and Holm corrections guard against a single false positive; the false discovery rate of Benjamini and Hochberg replaces that goal by the fraction of false leads in a list, and their procedure is worked through on the fifteen p-values of a heart attack trial, on a simulated screen of 10,000 genes, and on the Manhattan plot of a genome-wide study of 39,620 children. A dead salmon, the garden of forking paths, and the hundred replications of 2015 show where uncounted tests lead, and the knockoff filter shows how the lasso's selections can be tested honestly.
Unit 7 taught how one hypothesis is tested and what a p-value below 0.05 does and does not say. Almost no study tests one hypothesis. A clinical trial records a dozen outcomes, a brain scan holds a hundred thousand volume elements, and a genetic study tests eight million variants, and every one of these tests carries its own 5 per cent chance of a false alarm. This unit is about what the 5 per cent turns into when the tests are many, which corrections exist, what each of them promises, and how the field learned, from a dead fish and from a hundred repeated experiments, that the problem reaches further than any formula.
1 Many tests and the family-wise error rate
A test at the 5 per cent level rejects a true null hypothesis with probability 0.05, as Unit 7 defined the level. For one test that is a small risk; for twenty tests it is not. A cartoon of 2011 by Randall Munroe (xkcd, number 882) made the point for a wide public. Scientists test whether jelly beans cause acne and find nothing. Asked to test each of twenty colours separately, they find a result significant at the 5 per cent level for green jelly beans and nothing for the other nineteen, and the newspaper headline the next day reads “Green jelly beans linked to acne, 95% confidence”. Suppose that no colour has any effect at all. The probability of a headline then follows from the multiplication rule of Unit 3.
The probability that at least one of the true null hypotheses in a study is rejected is called the family-wise error rate, written FWER, where the family is the set of \(m\) tests of the study. For \(m\) independent tests that are all null it equals \(1 - (1 - \alpha)^m\), and Figure 1 shows how fast it grows. With 10 tests it is 0.40, with 50 tests 0.92, and with 100 tests 0.994. Particle physicists meet the same arithmetic under another name. For example, when they search for a new particle, they look for a bump in a plot of counts against mass, and a bump at any one of hundreds of possible masses would have been reported; they call this the look-elsewhere effect. Whatever the name, a single “significant” result among many uncorrected tests is, by itself, no evidence of anything.
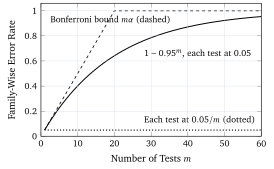
The oldest remedy is to make each test stricter. If every one of the \(m\) tests is run at the level \(\alpha/m\), the family-wise error rate can be at most \(\alpha\), whatever the dependence between the tests. The bound rests on an inequality that Carlo Emilio Bonferroni (1892-1960) published in 1936, and the rule carries his name.